Contents
Market Overview
Macro Review
Britannia unhinged. Miscommunication around the end of the UK’s temporary QE program ought to be over but Governor Bailey created a degree of ambiguity this week. The order of blame sees PM Truss placing responsibility on Chancellor Kwarteng, while he in turn shifted this to the Bank of England. Governor Bailey was steadfast, and his resolve ultimately forced the government into economic orthodoxy. The policy U-turn on Friday and subsequent sacking of the Chancellor of Exchequer was a clear departure from unfunded tax cuts. Kwasi Kwarteng lasted just 38 days in office, during which a ten-day mourning period occurred after the death of Queen Elizabeth II, which is the shortest tenure after Iain Macleod who died in 1970 after 30 days in the job after a heart attack. The move buoyed GBP and even triggered a Gilts rally, although the BOE was the main protagonist. The remarkable volatility in the 30-year Gilt moved in a range of 3.62-5.14% since September 28. We also had a hot U.S. CPI print with Core at 0.6% m/m and 6.6% y/y, with the headline of 0.4% m/m and 8.3% y/y. An initial sell-off on the above expectations release triggered a brief sell-off that turned into a developed markets equity-led squeeze as investors monetized equity derivatives. Nevertheless, the inflation figure shifted consensus to 75bps in Fed hikes in November and December, where 140bps into year-end is now priced in. Meanwhile, the ECB are closer to accepting a lower terminal rate as the debate is fervently on growth versus inflation, which incidentally was the largest theme from the IMF Conference in Washington DC. A debate that has been finely championed in Brazil as inflation this week moderated to 7.2%, having peaked at 12.1% in April. Chile also hiked 50bps and signalled the end of the tightening cycle but the litmus test for peak inflation will become clearer over the next month or two. The other central bank to signal limited hikes ahead was the Czech National Bank, although their punt is that weaker growth will moderate inflation.
EM Credit Update
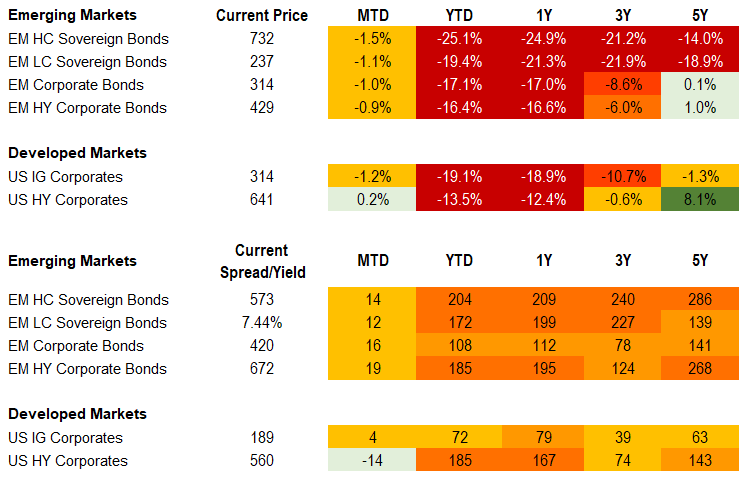
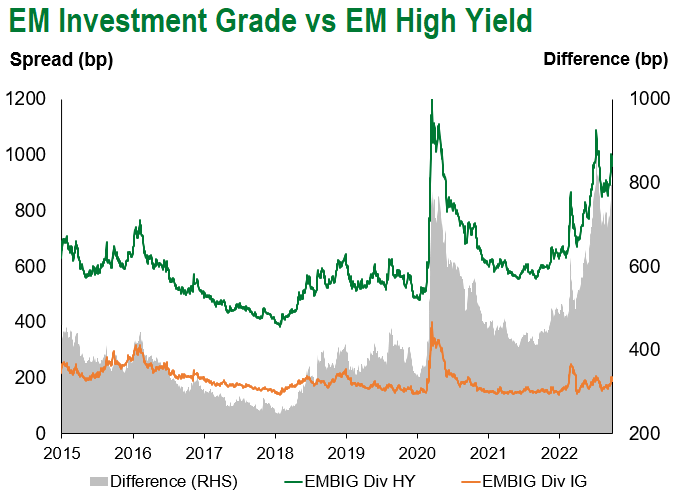
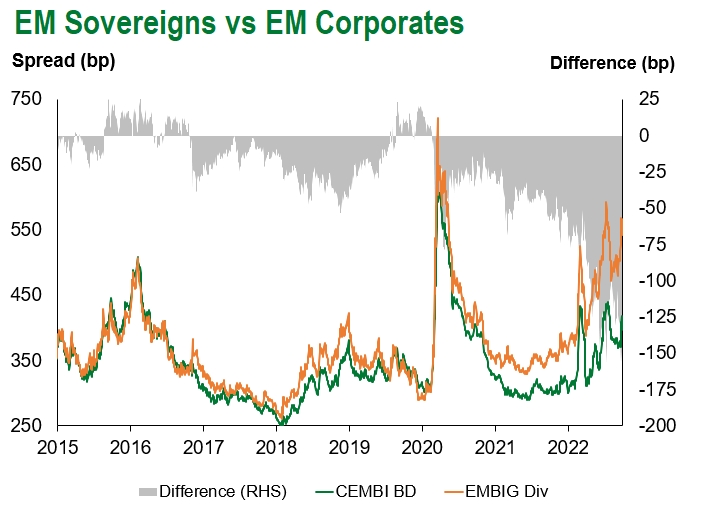
Emerging market sovereign credit (cash bonds) ended the week -2.0% with spreads 27bps wider. Outperformers over the week were Mongolia, Namibia and Armenia while Zambia, Pakistan and Sri Lanka underperformed.
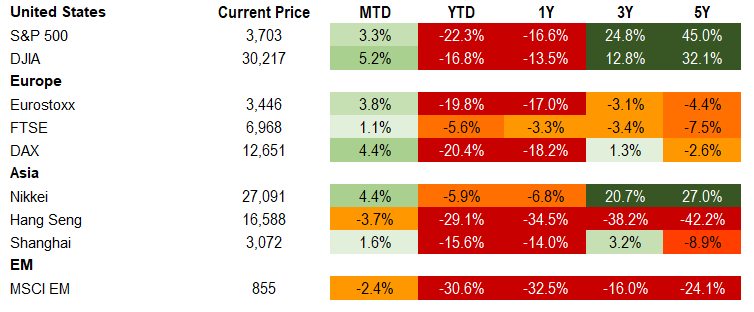
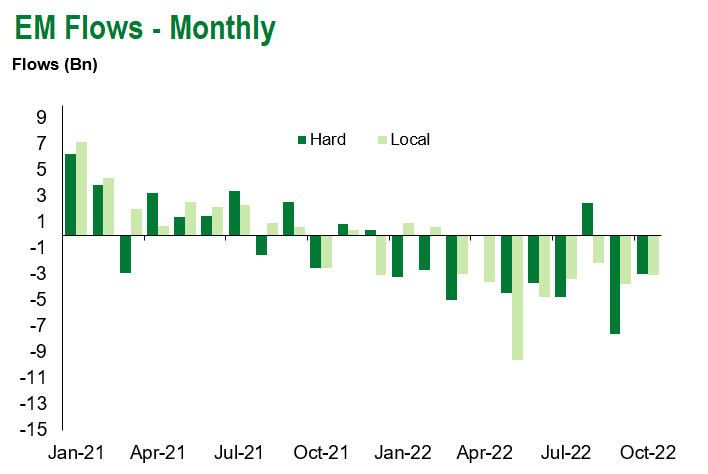
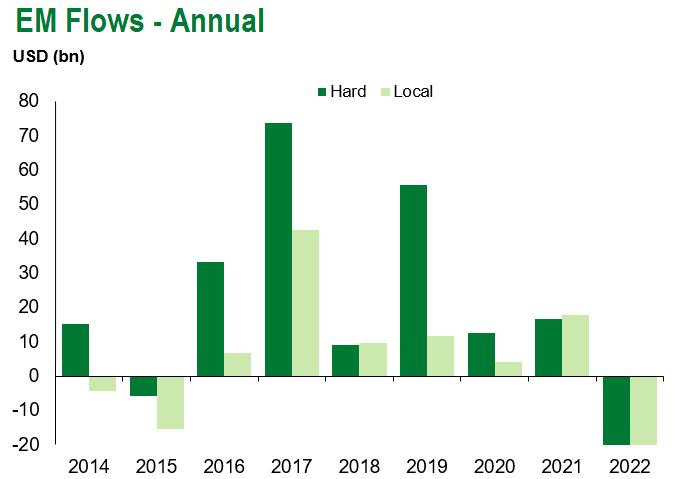
The S&P posted the largest intraday trading range since the pandemic on Thursday (via SPX and SPY), even though there was a larger intraday range in S&P futures that occurred on September 13th. The release of a higher-than-expected U.S. CPI highlighted that investors were over-hedged and monetized ITM options, and the gamma squeeze prompted dealers to buy the underlying index, which triggered a pop. Despite this, parts of emerging markets actually outperformed developed markets with SPY -2.0% and QQQ -3.9%, relative to emerging market equities (EEM -4.6%), credit (EMB -2.3%) and local currency bonds (EMLC -1.2%). We would also note that emerging markets fixed income traded broadly in line with U.S. IG and HY (LQD -2.0% and HYG -1.7%), but the EMB drawdown is now more than -25% year-to-date. In fact, European IG credit was the clear outperformer across all asset classes having rallied 0.3% this week. Clearly the focus was on core interest rates, where UK gilts rallied 20-30bps in the short-end (IGLT +1.2%) outperformed U.S. Treasuries which widened 11-19bps (TLT -2.5%).
The Week Ahead
The key focus of next week rests with 3Q earnings season. The once-every-five-year Chinese Party Congress will kick off on Sunday, where Xi Jinping is set to secure another term as party chief. Other important data releases cover the PBoC one-year LFR decision, Chinese 3Q GDP which ought to come in around 3.3%, retail sales of just under 4% and fixed asset growth of around 6%. Emerging market interest rate decisions are due from Indonesia (4.25%), Turkey (12%) and Ukraine (25%). Other events include Hong Kong and South African inflation, Mexican retail sales and Brazilian BCB activity indicators. Given the focus on developed markets forces over the past three weeks, UK inflation, Germany’s Zew survey and Euro-area inflation will be closely watched, along with any hype ahead of the ECB decision which comes at the end of the month.
Highlights from emerging markets discussed below include: The IMF’s latest World Economic Outlook paints a turbulent picture.
Fixed Income
Equities
Commodities

Source for data tables: Bloomberg, JPMorgan, Gramercy. EM Fixed Income is represented by the following JPMorgan Indicies: EMBI Global, GBI-EM Global Diversified, CEMBI Broad Diversified and CEMBI Broad High Yield. DM Fixed Income is represented by the JPMorgan JULI Total Return Index and Domestic High Yield Index. Fixed Income, Equity and Commodity data is as of October 14, 2022 (mid-afternoon).
Emerging Markets Weekly Highlights
The IMF’s latest World Economic Outlook paints a turbulent picture
Event: The Fund kept its 2022 global growth forecast unchanged from its update in July at 3.2% but further lowered its estimate for 2023 by 20bps to 2.7%, led by Europe. The IMF sees global inflation peaking in 3Q22 with a downward trajectory led by advanced economies in 2023. The report emphasizes the downside risks to the outlook and mounting challenges that the cost-of-living crisis, war in Ukraine, and slowdown in Chinese growth pose to the global economy and financial stability.
Gramercy commentary: While the global economic backdrop is undoubtedly difficult, the emerging market/developed market growth differential remains set to improve in 2023 to 2.6%, from 1.3% this year, as the slowdown is anticipated to stem mostly from developed markets. The report supports our view that the Fed and global central banks must remain vigilant in the fight against inflation while growth continues to stall, keeping the risk of market volatility elevated in the near-term. Economies which have adopted more conservative monetary and fiscal policies, particularly early-on, should fare better. This includes rate hikes, limited FX intervention in aim to preserve FX reserves and targeted social fiscal measures.
Emerging Markets Technicals
Emerging Markets Flows
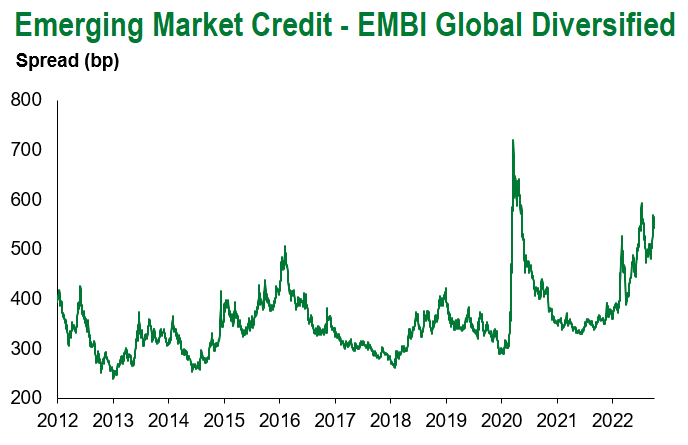
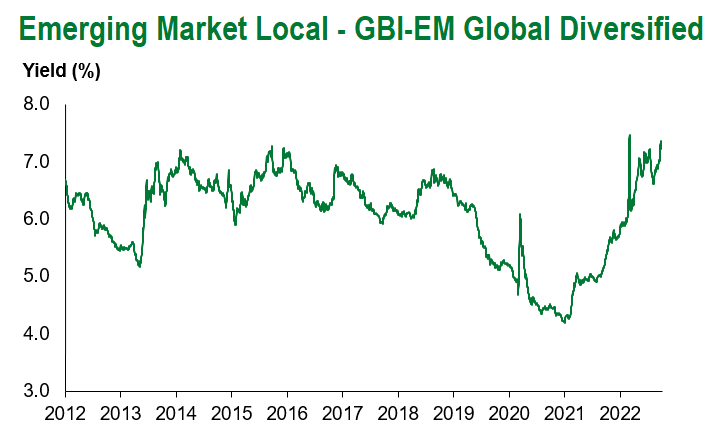
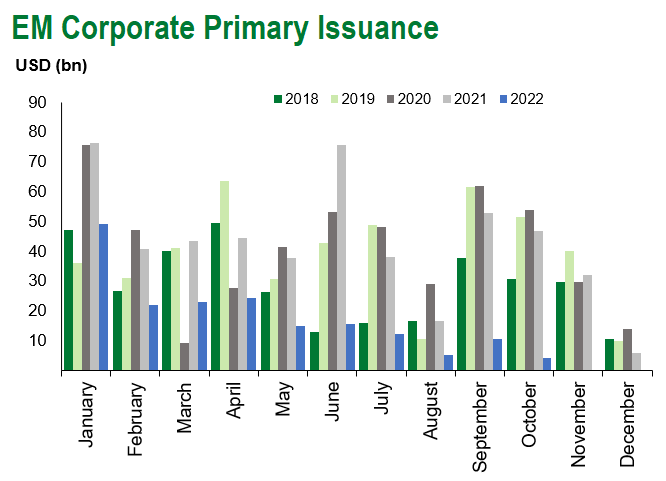
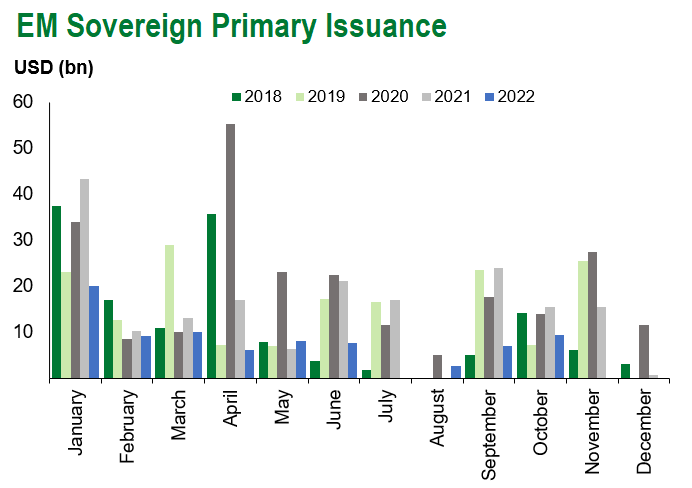
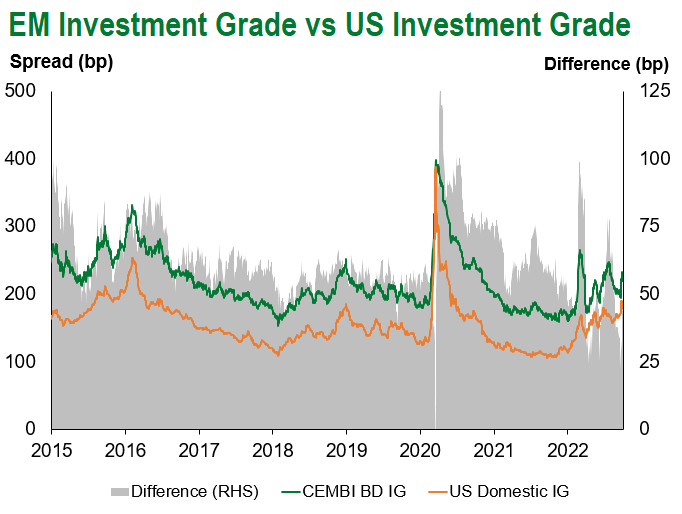
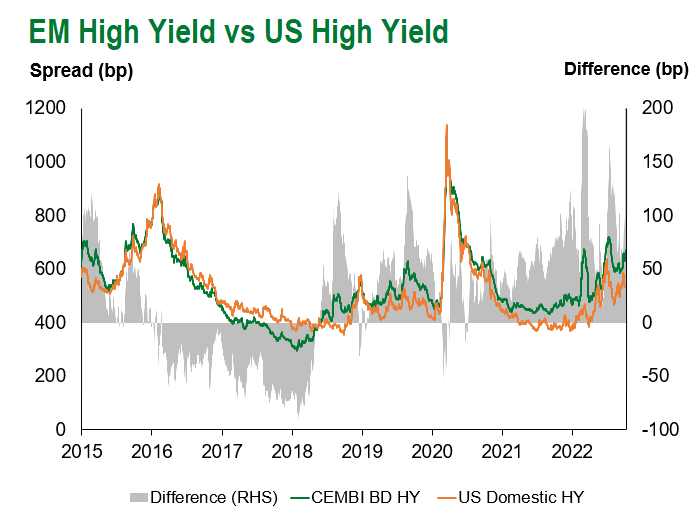
Source for graphs: Bloomberg, JPMorgan, Gramercy. As of October 14, 2022.
COVID Resources:
Johns Hopkins COVID-19 Case Tracker
For questions, please contact:
Kathryn Exum, CFA ESG, Director, Co-Head of Sovereign Research, [email protected]
Petar Atanasov, Director, Co-Head of Sovereign Research, [email protected]
James Barry, Director, Deputy Portfolio Manager, [email protected]
This document is for informational purposes only. The information presented is not intended to be relied upon as a forecast, research or investment advice, and is not a recommendation, offer or solicitation to buy or sell any securities or to adopt any investment strategy. Gramercy may have current investment positions in the securities or sovereigns mentioned above. The information and opinions contained in this paper are as of the date of initial publication, derived from proprietary and nonproprietary sources deemed by Gramercy to be reliable, are not necessarily all-inclusive and are not guaranteed as to accuracy. This paper may contain “forward-looking” information that is not purely historical in nature. Such information may include, among other things, projections and forecasts. There is no guarantee that any forecasts made will come to pass. Reliance upon information in this paper is at the sole discretion of the reader. You should not rely on this presentation as the basis upon which to make an investment decision. Investment involves risk. There can be no assurance that investment objectives will be achieved. Investors must be prepared to bear the risk of a total loss of their investment. These risks are often heightened for investments in emerging/developing markets or smaller capital markets. International investing involves risks, including risks related to foreign currency, limited liquidity, less government regulation, and the possibility of substantial volatility due to adverse political, economic or other developments. References to any indices are for informational and general comparative purposes only. The performance data of various indices mentioned in this update are updated and released on a periodic basis before finalization. The performance data of various indices presented herein was current as of the date of the presentation. Please refer to data returns of the separate indices if you desire additional or updated information. Indices are unmanaged, and their performance results do not reflect the impact of fees, expenses, or taxes that may be incurred through an investment with Gramercy. Returns for indices assume dividend reinvestment. An investment cannot be made directly in an index. Accordingly, comparing results shown to those of such indices may be of limited use. The information provided herein is neither tax nor legal advice. Investors should speak to their tax professional for specific information regarding their tax situation.
