Authored by:
Philip Meier, Managing Director, Head of Emerging Markets Debt
Belinda Hill, CFA, Managing Director, Emerging Markets Debt Portfolio Manager
James Barry, CFA, Director, Emerging Markets Debt Deputy Portfolio Manager
Cassiano dos Santos, CFA, Vice President, Research Analyst
August 2022
The Case for Emerging Markets Corporates in Today’s Dislocated Markets
So far, 2022 has been a difficult year for investors who have had to grapple with elevated levels of macroeconomic uncertainty and market volatility as the lingering effects of the COVID pandemic, combined with the Russian invasion of Ukraine, pushed inflation higher and accelerated the tightening of global financial conditions. Most recently, interest rate and inflation fears have given way to concerns over credit risk as the prospects for a global recession increase amidst lower growth projections stemming from Zero-COVID policies in China, higher gas prices in Europe and higher rates in the U.S. Indeed, the latest IMF projections for 2022 have already reduced world output growth down to 3.2% from 4.4% in January. In this context, emerging markets (“EM”) credit has experienced one of the top three dislocations seen in the past 20+ years in the asset class. Year to date, the USD EM Sovereign Index (JPM EMBI Global Diversified) and USD EM Corporate Index (JPM CEMBI Broad Diversified) have returned -18% and -13%, respectively, through July 31st.
For EM sovereigns, the negative return this year is somewhat justified by the fundamental deterioration in many sovereigns’ balance sheets as the public sector bore the brunt of the COVID response cost and some countries now have to contend with higher food and energy costs. However, EM corporates stand in contrast to this with valuations and technicals that have decoupled from corporate fundamentals, which are at their strongest level in over 10 years. EM corporates proved to be extremely resilient through the worst of the COVID pandemic and benefited greatly from the recovery in 2021, with net leverage reduction in almost every sector. Fundamentals continued to be strong through first quarter 2022 and while some deterioration can be expected on the back of slower growth dynamics, given the strength of balance sheets today, EM corporates are well positioned to navigate continued inflationary pressures or a recessionary environment.
Despite strong fundamentals, however, EM corporates have underperformed other comparable asset classes, such as U.S. high yield (“HY”) and EUR HY, which have much weaker fundamentals and are only down 8.3% and 10%, respectively, through July 31st. On a spread per turn of net leverage, a measure of debt vulnerability, investors are now paid 3.5x and 8.9x more to own EM IG vs U.S. IG or EUR IG, respectively. For high yield, investors are paid 2.5x and 2.8x more to own EM HY vs. U.S. HY and EUR HY, respectively. This suggests that EM corporates have been penalized more aggressively for simply being in the wrong zip code.
From our perspective, these market dynamics provide an attractive opportunity for investors to buy into fundamentally sound EM corporates at historically low levels for expected outsized returns over the next 12 to 24 months. Nonetheless, given the balance of risks that remain in the global macroeconomic landscape, we believe an active manager with experience in EM corporates through various credit cycles is critical in order to avoid non-recoverable mistakes and harness the return potential of the current opportunity in this asset class.
EM CORPORATE FUNDAMENTALS ARE STRONG
EM corporate fundamentals are the strongest in 10 years
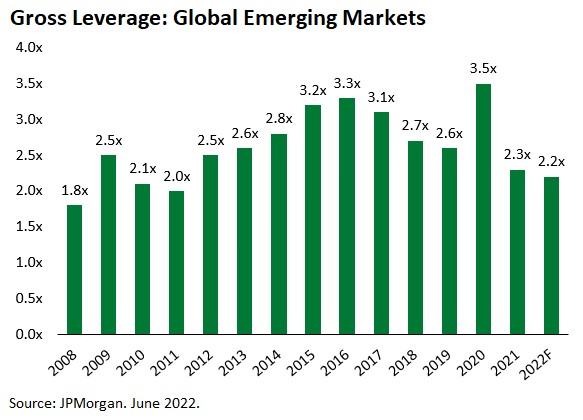
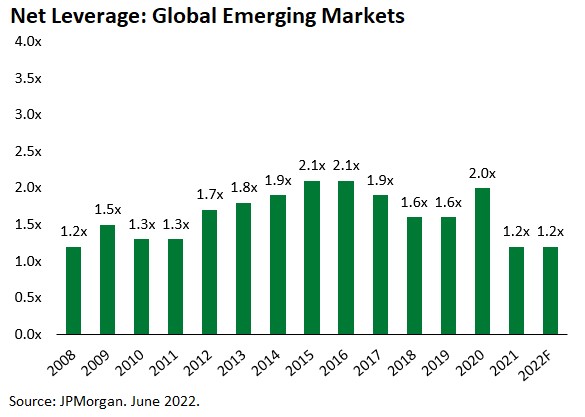
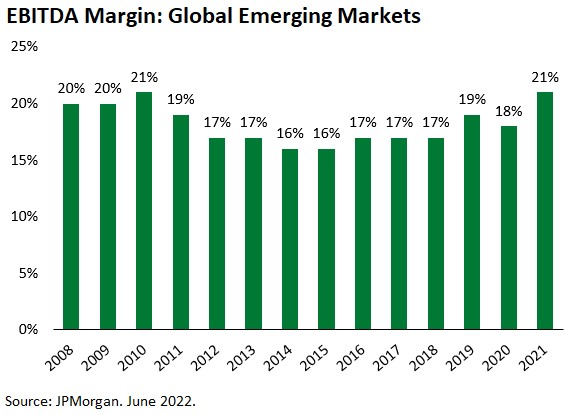
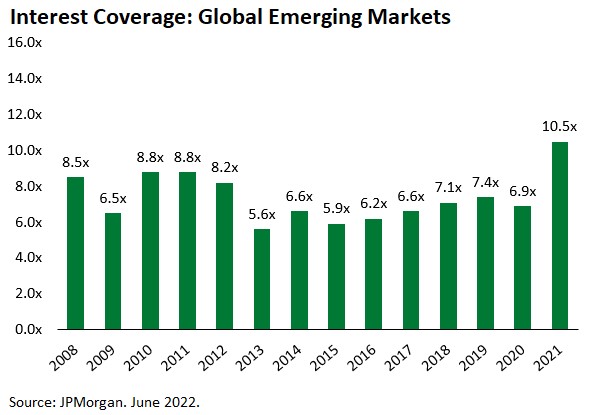
EM corporates have shown resiliency amid the COVID pandemic. We have seen the implementation of financially conservative policies that delivered stronger credit metrics in 2021 versus pre-pandemic levels and set up a strong foundation to face potential macroeconomic headwinds. In 2021, top and bottom lines for EM corporates expanded by the most since 2010. Net leverage in EM corporates ended 2021 at 1.2x, down from the pandemic peak of 2.0x in 2020 and 10-year high of 2.1x in 2016. This historically low net leverage was last observed in 2008. Moreover, margins and interest coverage are at the best levels since 2008, setting a strong fundamental backdrop to navigate potential challenges in 2022.
Despite the rising macroeconomic concerns around the world, EM corporates continued to show strong results in 1Q22. Revenues and EBITDA increased by 25% year-over-year, driven especially by strong numbers from commodity-exposed companies and partly by the nominal effects of higher inflation. EBITDA margins remain at historically high levels. Beyond that, disciplined capital allocation and sound cost management have led to strong cash generation, as evidenced by decreasing net debt among EM corporates since 1Q21. Across multiple sectors, pent-up demand amid continuing supply constraints have enabled companies to successfully implement price hikes to offset rising input, transport and labor costs.
Emerging markets corporate fundamentals compare favorably to developed market (“DM”) corporates
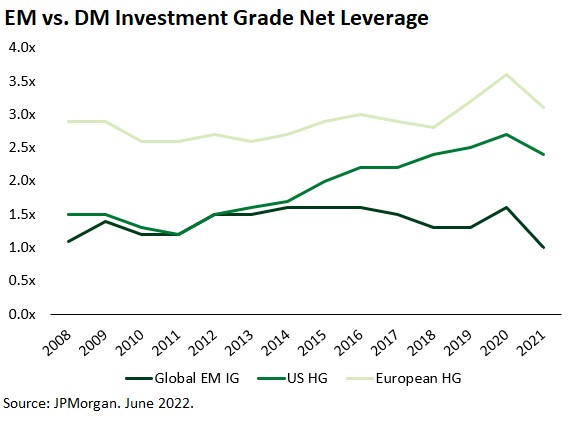
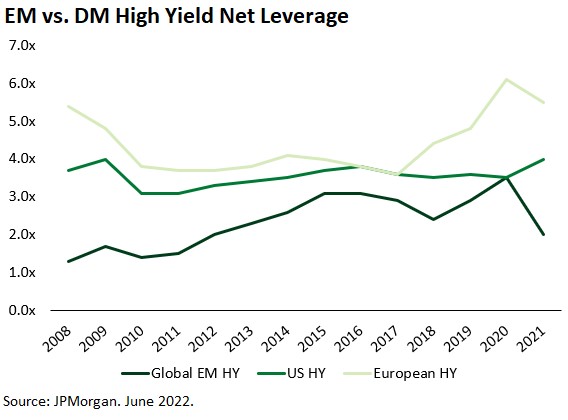
The sound relative positioning of EM is particularly evidenced by the widest discrepancy in gross and net leverage between EM and DM corporates since the 2008 Financial Crisis. In investment grade, the discrepancy at year-end 2021 shows the widest gap in the last 15 years both against U.S. and EUR IG issuers with EM IG net leverage at 1.0x versus U.S. IG at 2.4x and European IG at 3.1x. Similarly, in HY, the gap is the widest since the 2008 Financial Crisis with EM HY net leverage at 2.0x versus U.S. HY at 4.0x and EUR HY at 5.5x. In addition, the deleveraging of EM corporates between pandemic-troubled 2020 and 2021 outpaced the deleveraging seen from DM peers in both IG and HY for the same period, illustrating the fundamental outperformance of EM in 2021 and setting a strong backdrop for 2022. The outperformance seen in 2021 underscores why EM corporate fundamentals compare favorably to DM and, given the EM resiliency in more challenging scenarios, there is likely scope for additional outperformance in 2022.
Despite further headwinds, emerging markets corporate fundamentals should continue to be resilient
For 2022, margins are expected to normalize from historically high levels seen in 2021, especially on a year-over-year basis. Despite the macroeconomic uncertainties that remain in 2022, however, EM corporates are still likely to continue to reduce net leverage. While DM corporates do not have much experience navigating high inflationary environments, EM corporates are used to operating through uncertain macroeconomic backdrops that include not only high inflation, but also stagflation, FX volatility, etc. Moreover, the EM landscape is often characterized by many commodity-driven companies with low cash cost curves that can continue to improve the underlying balance sheet, despite downward pricing pressure across underlying commodities. As recent as in 1Q22, some sectors have posted year-over-year EBITDA margin expansion, namely oil and gas, industrials, pulp and paper, and transport. The nominal effects of inflation should result in top-line growth, coupled with moderating, yet high, EBITDA margins. The continuation of strong cash generation across multiple sectors and somewhat stable gross debt should pave the path towards stable to slightly lower leverage for EM corporates in 2022.
DEFAULT RATES HIGHER DUE TO SPECIAL SITUATIONS; ADJUSTED DEFAULT RATE IS MODERATE
The overall default rate in EM, which currently stands at 8.1%, has ticked higher due to well-telegraphed special situations. The largest driver of this default rate has been the Chinese property sector, which has been particularly vulnerable since May 2021 and where defaults were already expected to be abundant. Within the Chinese property sector, we have already witnessed 27 defaults or distressed exchanges since the crisis broke out last summer. Another large contributor to the default rate in 2022 has been Russia/Ukraine, where tensions started brewing in November 2021 as the U.S. flagged Russian interference and the likelihood of a conflict and subsequent defaults increased dramatically. If we exclude the Chinese property sector and Russia/Ukraine, then the adjusted corporate default rate through June 30th is only 0.6%. This compares to the U.S. HY and EUR HY default rates year to date of 1.0% and 0.3%, respectively. For 2022, the adjusted corporate default rate is expected to close at a moderate 2% according to JPMorgan.

AMORTIZATION PROFILE FOR EM CORPORATES IS MANAGEABLE
The combination of tighter monetary policy and the broader risk-off sentiment has limited primary market issuance this year. EM primary issuance remains at depressed levels of $159bn, down 55% relative to 2021. In fact, EM corporate issuance is at an 11-year low. In terms of EM corporate issuance in 2022, Asia represents the lion share of the picture at 70%, up from 52% in 2021. We do not expect weaker primary markets, indeed even limited market access, to lead to more defaults given that a large number of EM corporates completed liability management exercises in recent years to extend their maturity profiles. With lower gross issuance and a steady debt roll-off, there should be negative net supply, which creates a supportive technical for the asset class as fund flows are reinvested.
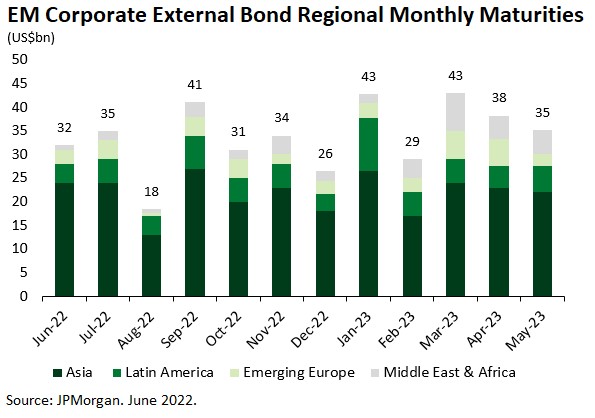
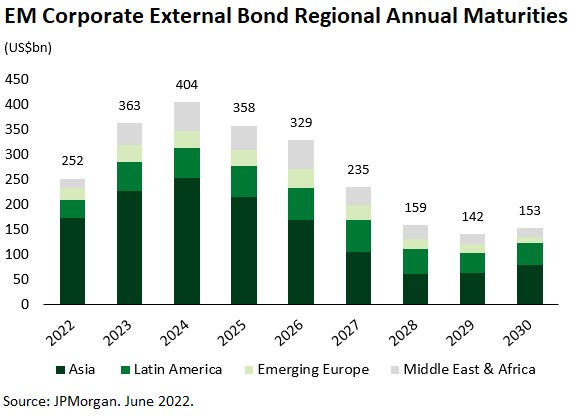
Looking more closely at the aggregate amortization profile of EM corporates through 2025, most maturities are concentrated in IG corporates, which should have easier access to the primary market, albeit at more expensive rates, as well as to alternative sources of funding.
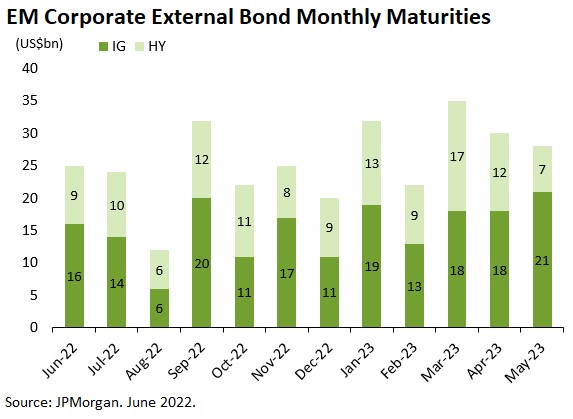
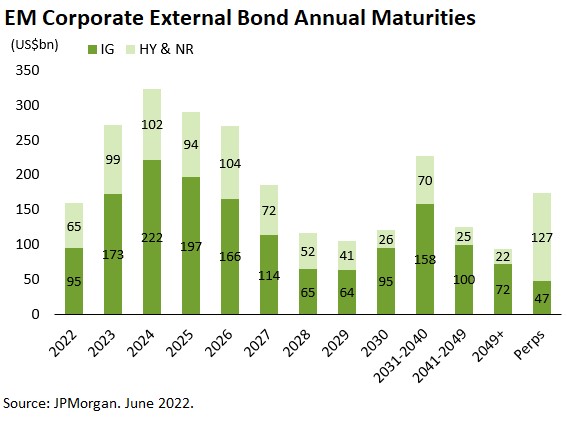
Furthermore, Asia represents 63% of total debt amortizations in EM corporates through 2025. Asia is a region with a historically deep local market and investor base which can serve as a significant source of alternative funding when the USD primary bond market is weak. Other than China, one of the only countries with a more elevated HY debt stock due before the end of the year is Turkey ($4.9bn). Turkey also has a deep local market in which corporates are able to refinance debt. Through 2025, Turkey’s corporate debt maturities stand at $8.6bn, however, 72% of this amount is from stable private banks with alternative sources of capital. Altogether there are just 11 countries with over $1bn in HY or non-rated maturities, which suggests that any default risk can be more easily manageable and identified as to where potential risks lie.
INVESTORS ARE BETTER COMPENSATED FOR CREDIT RISK IN EM CORPORATES RELATIVE TO DM CORPORATES
EM corporates have less than half the net leverage of DM corporates (1.0x and 2.0x for EM IG and HY versus 2.4x and 4.0x for US IG and HY and 3.1x and 5.5x for EUR IG and HY, respectively). Despite stronger fundamentals, however, EM corporates have underperformed U.S. HY and EUR HY with a return of -13% vs -8.1% and -10%, respectively. This suggests that they have been penalized more aggressively for simply being in the wrong zip code. This provides a significant opportunity for investing in fundamentally sound corporates in EM at better levels than in DM to realize higher returns. EM IG and HY corporates currently trade at a spread per turn of net leverage of 239bps and 326bps, respectively.
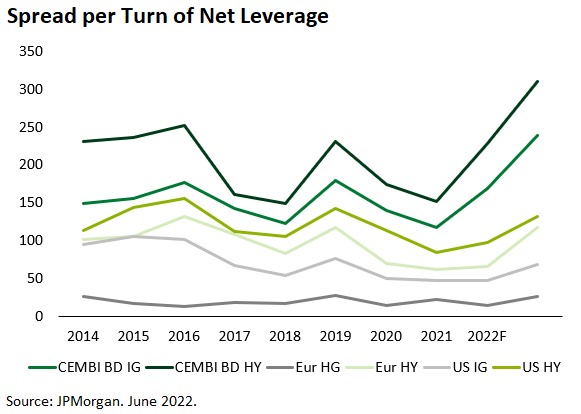
This compares to 69bps and 132bps for U.S. IG and HY, respectively, and 27bps and 118bps for EUR IG and HY, respectively. This means that on a spread per turn of net leverage, investors are now paid 3.5x and 8.9x more to own EM IG vs U.S. IG or EUR IG, respectively. For HY, investors are paid 2.5x and 2.8x more to own EM HY vs U.S. HY and EUR HY, respectively.
CAPITALIZING ON EM CORPORATE OPPORTUNITIES WITH ACTIVE MANAGEMENT
We believe that the historic drawdown that we have witnessed in EM corporates year to date, coupled with fundamentals that are at their strongest level in over 10 years, provides a unique opportunity for investors to buy into fundamentally sound EM corporates at historically low spread levels for expected outsized returns over the next 12 to 24 months. Given the level of macroeconomic uncertainties, however, experience makes a difference. Passive investors may be exposed to a greater share of unrecoverable mistakes in the current environment than active managers, especially those, with long dated experience in emerging markets through various cycles. Credit selection continues to be an important component of alpha-generation and a deep bench of emerging markets research analysts and portfolio managers that understand the intricacies of emerging markets credit is the only way to separate the good from the bad.
About Gramercy
Gramercy is a dedicated emerging markets investment manager based in Greenwich, Connecticut with offices in London, Buenos Aires and Mexico City, and dedicated lending platforms in Mexico, Turkey, Peru, Pan-Africa, Brazil, and Colombia. The firm, founded in 1998, seeks to provide investors with attractive risk-adjusted returns through a comprehensive approach to emerging markets supported by a transparent and robust institutional platform. Gramercy offers alternative and long-only strategies across emerging markets asset classes including multi-asset, private credit, public credit, and special situations. Gramercy is a Registered Investment Adviser with the SEC and a Signatory of the Principles for Responsible Investment (PRI). Gramercy Ltd, an affiliate, is registered with the FCA.
Contact Information:
Gramercy Funds Management LLC
20 Dayton Ave
Greenwich, CT 06830
Phone: +1 203 552 1900
www.gramercy.com
Joe Griffin
Managing Director, Business Development
+1 203 552 1927
[email protected]
Investor Relations
[email protected]
This document is for informational purposes only, is not intended for public use or distribution and is for the sole use of the recipient. It is not intended as an offer or solicitation for the purchase or sale of any financial instruments or any investment interest in any fund or as an official confirmation of any transaction. The information contained herein, including all market prices, data and other information, are not warranted as to completeness or accuracy and are subject to change without notice at the sole and absolute discretion of Gramercy. This material is not intended to provide and should not be relied upon for accounting, tax, legal advice or investment recommendations. Certain statements made in this presentation are forward-looking and are subject to risks and uncertainties. The forward-looking statements made are based on our beliefs, assumptions and expectations of future performance, taking into account information currently available to us. Actual results could differ materially from the forward-looking statements made in this presentation. When we use the words “believe,” “expect,” “anticipate,” “plan,” “will,” “intend” or other similar expressions, we are identifying forward-looking statements. These statements are based on information available to Gramercy as of the date hereof; and Gramercy’s actual results or actions could differ materially from those stated or implied, due to risks and uncertainties associated with its business. Past performance is not necessarily indicative of future results. References to any indices are for informational and general comparative purposes only. The performance data of various indices mentioned in this update are updated and released on a periodic basis before finalization. The performance data of various indices presented herein was current as of the date of the presentation. Please refer to data returns of the separate indices if you desire additional or updated information. Indices are unmanaged, and their performance results do not reflect the impact of fees, expenses, or taxes that may be incurred through an investment with Gramercy. Returns for indices assume dividend reinvestment. An investment cannot be made directly in an index. Accordingly, comparing results shown to those of such indices may be of limited use. This presentation is strictly confidential and may not be reproduced or redistributed, in whole or in part, in any form or by any means. © 2022 Gramercy Funds Management LLC. All rights reserved.
