


Contents
Market Overview
Macro Update
The Middle East conflict whipsawed rather than escalated in a straight line this week. Strikes between the U.S. and Iran paused early in the week to give diplomacy “space,” as Oman launched a regional mediation push and Iran hosted talks on Strait of Hormuz navigation with Saudi Arabia and Oman, which President Trump characterized as “good.” By Thursday, however, the channel had frayed again. The U.S. launched what it described as a heavy wave of strikes following an attempted Iranian attack on U.S. assets. Tehran responded by hitting military infrastructure at Kuwait’s Ahmad al-Jaber Air Base, and on Friday the IRGC said it struck two tankers attempting to transit the Strait of Hormuz under U.S. escort.
Against this volatile backdrop, Brent finished the week around $90, down roughly 8-9% on the week from the prior Friday’s brush with $100, though still up more than 20% in July. This week’s oil retreat reflected an improving physical picture as much as the diplomatic interlude. Tanker traffic through the Strait of Hormuz picked up after weeks of near-paralysis, allowing millions of barrels to move, while Saudi Arabia convened representatives of 43 countries to discuss a maritime coalition to protect Red Sea shipping against the Houthi blockade.
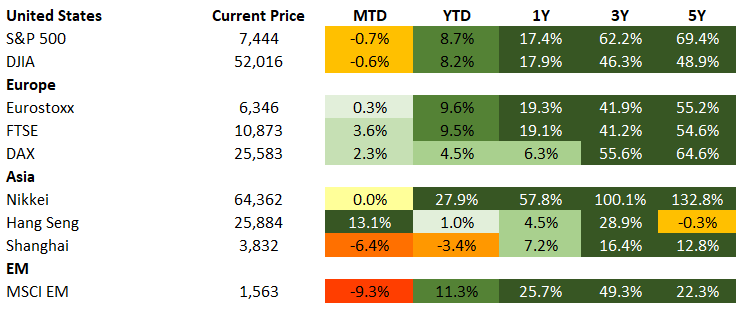
Beyond geopolitics, the week’s centerpiece was the July 28-29 FOMC meeting. The Warsh Fed held the funds rate at 3.50-3.75% in a 9-3 vote, with Cleveland’s Hammack, Minneapolis’s Kashkari, and Dallas’s Logan all dissenting in favor of a 25bps hike, extending the run of split decisions that has become a hallmark of this Fed. Chair Warsh called the hold “especially prudent at these uncertain times” and stressed that the Committee has no “soft or implicit” inflation target; in his press conference, Warsh continued to shy away from any forward guidance. However, markets interpreted this as some erosion in transparency, reviving concerns about Fed credibility and weighing heavily on the USD. The Dow fell around 800 points on decision day before recovering; markets head into next week’s jobs report pricing roughly a two-in-three chance of a hike at the September 15-16 meeting.
In U.S. macro data, the advance estimate showed 2Q GDP slowing to 1.5% annualized, well below the 2.0% consensus and the 1Q pace (2.1%), dragged by a downturn in government spending and a wider net-trade drag. Core PCE eased to 3.3% YoY from May’s three-year high of 3.4%, and headline PCE dropped to 3.7% from 4.1% as the June gasoline retreat washed through – relief that July’s renewed oil spike threatens to reverse. Jobless claims stayed low at 197k, while consumer confidence and durable goods orders both undershot expectations.
The mega-cap earnings verdict, the week’s other main event, split cleanly on a single question: is AI capex translating into revenue? Microsoft surged around 15% after Azure grew 43% in constant currency and crossed $100 billion in annual revenue for the first time, with capital spending framed as steady. Amazon jumped nearly 12% on booming AWS growth and evidence of AI monetization, even as it lifted 2026 capex to $220 billion. On the losing side of the ledger, Meta tumbled around 9% on an EPS miss, disappointing cash flow, and a soft 3Q revenue guide, while Apple, which had briefly become the first $5 trillion company earlier in the week, fell almost 8% on weak revenue guidance. The net effect was a mixed close for U.S. equities and VIX easing back toward 17 before rebounding to ~19.
In FX, the dollar finally gave back ground, with the DXY falling more than 1% on the week to around 100. The pivotal move came in the yen. After the currency touched a fresh 40-year low near 164, Japan conducted yen-buying intervention in the New York session Thursday night, reportedly with U.S. authorities conducting supporting rate checks, giving the operation a coordinated character, driving the yen as strong as 158 before it partially retraced. The BoJ then held its policy rate at 1% on Friday in an 8-1 vote but warned for the first time that underlying inflation is likely to run “clearly above” its 2% target in the second half of the year, keeping an autumn hike in play. Gold remained anchored in the low-$4,000s.
European data delivered the week’s upside surprises. Eurozone 2Q GDP grew 0.4% QoQ, double the consensus and a marked acceleration from a flat 1Q, led by Ireland and a resilient Spain, while the July flash HICP re-accelerated to 2.9% YoY (core 2.5%), with energy prices up 10% on the year. In the UK, the Bank of England kept its policy rate on hold at 3.75%, as expected.
China rounded out the week on a soft note. The official July PMIs fell into contraction across the board – manufacturing at 49.2 (a five-month low, on a sharp drop in new orders), non-manufacturing at 49.0, construction at a record-low 47.0, and the composite (49.3) at its weakest since 2022 – just a day after the Politburo’s mid-year meeting acknowledged the “difficulties and challenges facing the economy” and pledged accelerated fiscal spending and incremental support measures. The yuan eased from a three-year peak on the data, and the readings sharpened the global demand concerns already weighing on crude.
EM Credit Update
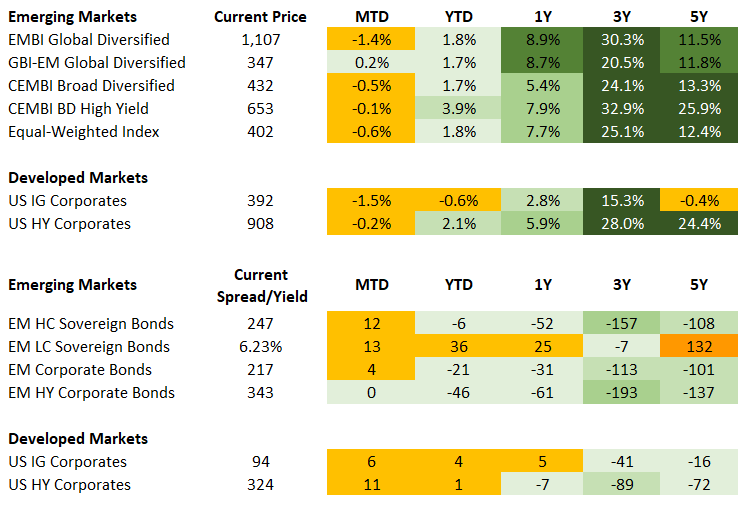
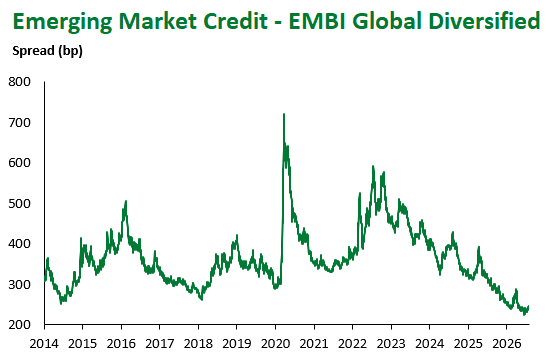
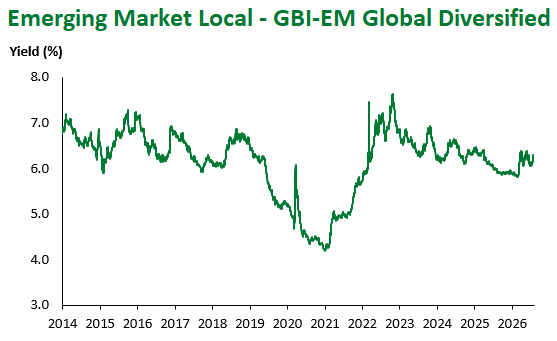
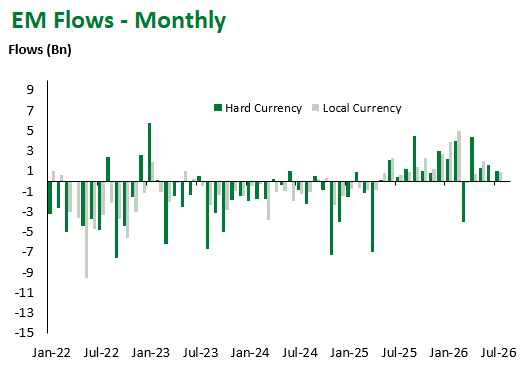
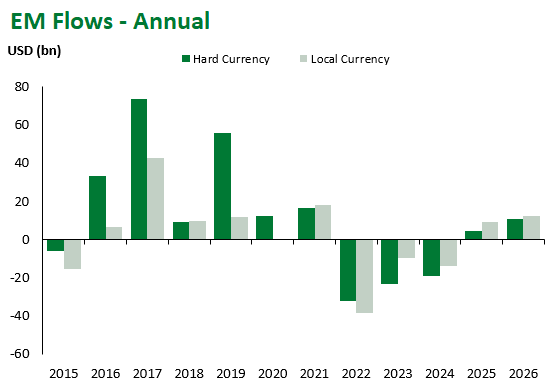
Emerging Markets (EM) fixed income posted a split week, with local currency sovereigns clearly outperforming (+0.95%) while hard currency sovereigns (-0.07%) and corporates (-0.02%) finished roughly flat. The dispersion was driven by a sharp U.S. dollar sell-off following Fed Chair Warsh’s press conference, which raised concerns about Fed credibility. Dollar weakness translated directly into FX gains for local markets, while the same credibility concerns pressured the long end of the curve and weighed on the more rate-sensitive, longer-duration segments of the hard currency complex.
Local currency sovereign debt was the standout performer, advancing +0.95% at the index level, with the return overwhelmingly currency driven. Colombia (+3.89%), South Africa (+2.91%), Chile (+2.61%), Hungary (+2.53%), and Poland (+2.29%) led gains, in each case powered predominantly by FX; Chile’s move was almost entirely currency (FX +2.47% of a +2.61% total), while Colombia and South Africa saw price and FX both contribute meaningfully. At the other end, Indonesia (-0.81%) lagged on currency weakness (FX -0.96%) tied to central bank independence concerns, while Uruguay (-0.60%) declined on a price-led drop (-0.59%) as local currency issuance weighed on the market. Türkiye(+1.05%) was notable for posting a positive total despite FX drag (-0.36%), with carry (+0.55%) doing the work.
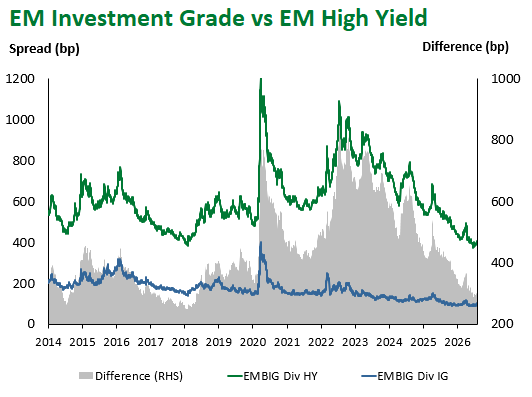
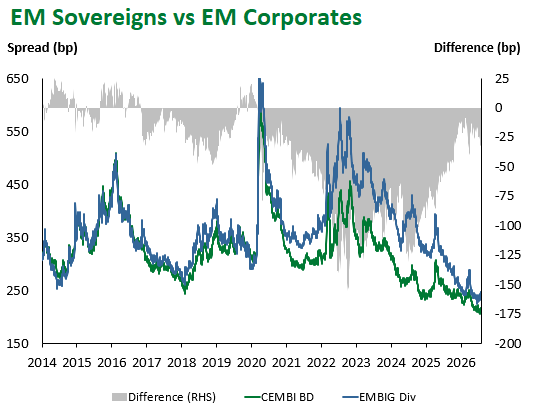
Hard currency sovereign bonds slipped -0.07% at the index level, with high yield (+0.05%) outperforming investment grade (-0.19%). The IG underperformance is consistent with its longer duration profile amid the long-end sell-off. The 10+ year bucket returned -0.47% against +0.20% for the 1-3 year segment, and by rating the CCC cohort led (+0.79%) while higher-quality buckets lagged. Regionally, the Middle East (+0.28%) and Africa (+0.08%) outperformed, while Latin America (-0.29%) was the clear laggard and Asia (-0.08%) was modestly negative. At the country level, Lebanon (+7.38%), Gabon (+1.88%), Sri Lanka (+1.00%), and Senegal (+0.97%) led, while Venezuela (-0.82%), Jamaica (-0.75%), Ecuador (-0.57%), and Panama (-0.56%) lagged.
EM corporates were essentially unchanged at -0.02%, and unlike sovereigns showed no differentiation between investment grade (-0.02%) and high yield (-0.02%). The duration pattern mirrored sovereigns, with the short end positive (1-3 year +0.09%) and the long end negative (10+ year -0.27%). By rating, the CCC segment led (+0.25%) alongside AAA (+0.10%), while BB (-0.10%) lagged. Regionally, Asia (+0.05%) and Africa (+0.04%) were the only positive regions, while Latin America (-0.11%) and the Middle East (-0.08%) underperformed.
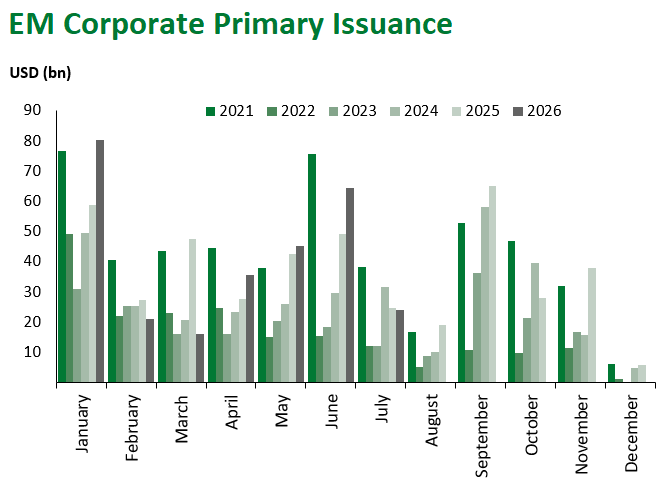
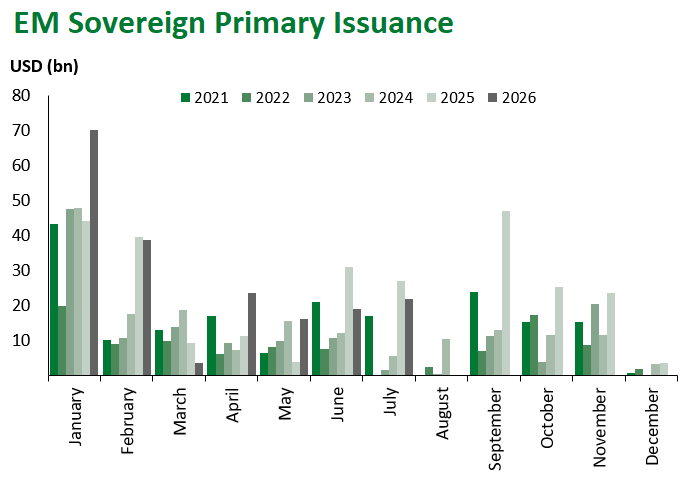
Primary market activity was moderate, with six issuers pricing approximately $6.2 billion in hard currency supply, skewed toward investment grade (roughly $4.9 billion across six tranches) and sovereign borrowers. Chile anchored the week with a triple-tranche euro deal totaling €3.1 billion (2034, 2038, and 2046 maturities), and Uruguay tapped the dollar market for $350 million at a 5.356% yield. Gabon returned as the sole frontier high yield sovereign, raising $920 million in a 2033 private placement bond at a 12.650% yield (CCC-). On the corporate side, TAQA of Abu Dhabi priced $750 million at 5.125%, KEB Hana Bank of Korea placed $300 million of floating-rate paper, and AES España in the Dominican Republic brought a $500 million high yield deal at 7.75%. Over half of the week’s supply was euro-denominated, reflecting Chile’s size.
The Week Ahead
The July U.S. jobs report on Friday is the pivotal release, arriving with markets pricing roughly a two-in-three probability of a September Fed hike. After June’s 57k miss, consensus looks for a modest rebound to around 85k with unemployment steady at 4.2%, a print soft enough to keep the Fed patient but strong enough to avoid recession fears. ISM manufacturing and services, JOLTS, and ADP employment fill out the U.S. calendar, while the 2Q earnings season broadens beyond the mega-caps to AMD, Caterpillar, Disney, Eli Lilly, Palantir, and Uber, with AI-linked names still trading on the capex-versus-monetization divide. In China, RatingDog PMIs, trade data, and July inflation offer the first test of whether the post-Politburo stimulus expectations are justified. The EM central bank calendar features Brazil’s COPOM, where the easing cycle is expected to continue with a 25bps cut to 14.00%, and India’s RBI (expected to hold at 5.25%) squeezed between elevated oil and softening growth. Geopolitically, the barometers are whether the resumption of U.S.-Iran strikes swamps the Omani-mediated diplomatic track and the Hormuz navigation talks, progress on the Saudi-led Red Sea maritime coalition, chokepoint throughput in both the Strait of Hormuz and Bab el-Mandeb, and any retaliation against the new U.S. tariffs now in effect on 60 trading partners.
Fixed Income
Equities
Commodities

Source for data tables: Bloomberg, JPMorgan, Gramercy. EM Fixed Income is represented by the following JPMorgan Indicies: EMBI Global, GBI-EM Global Diversified, CEMBI Broad Diversified and CEMBI Broad High Yield. DM Fixed Income is represented by the JPMorgan JULI Total Return Index and Domestic High Yield Index. Fixed Income, Equity and Commodity data is as of July 31, 2026 (mid-day).
Highlights
Indonesia’s Central Bank Governor departure deepens institutional credibility concerns
Event: Bank Indonesia Governor Perry Warjiyo resigned on July 27, two years before the end of his second term, citing unspecified “personal reasons.” Senior Deputy Governor Destry Damayanti has assumed the role of interim governor under BI Law while President Prabowo nominates a permanent successor. The resignation follows last week’s Bank Indonesia decision to leave the policy rate unchanged, contrary to market expectations for a 25bps hike. Indonesian assets have remained under pressure, with the rupiah and local-currency bonds continuing to underperform regional peers.
Gramercy Commentary: The resignation, less than two months after parliament enacted legislation expanding Bank Indonesia’s growth mandate and strengthening legislative influence over the central bank, further raises credibility concerns and increases uncertainty around the near-term policy path. This follows long-time technocrat Sri Mulyani’s removal from the Ministry of Finance last year, appointment of President Probowo’s nephew Thomas Djiwandono to deputy governor earlier this year, and growing governance concerns related to the opaque state investment holding company, Dananatara. The choice of a successor is now a fresh catalyst for Indonesian markets. A technocratic appointment, including confirmation of Damayanti, could help restore confidence and stabilize assets, while a politically aligned nominee combined with eroding monetary policy effectiveness would likely intensify pressure on the rupiah and local rates, while increasing sovereign ratings scrutiny. Although macroeconomic and credit fundamentals do not yet point to imminent rating action, the steady erosion of institutional independence has become a dominant risk for investors compounded by spillover effects from the ongoing conflict in the Middle East and risk of climate related headwinds.
Brazil polls keep Lula ahead of Bolsonaro as start of formal campaigns nears
Event: The latest polls ahead of the October presidential election show President Lula leading Senator Flávio Bolsonaro by 6.3 points in a runoff simulation (49.2% vs. 42.9%), little changed from the 6.5-point lead in early July. Polls have been remarkably stable since early June and are unlikely to shift materially until official campaigning begins on August 16, when media coverage and debates lift voter awareness.
Gramercy Commentary: President Lula’s approval ratings and re-election prospects have benefited from various economic stimulus measures as well as a series of missteps by his main right-wing challenger Senator Flavio Bolsonaro, whose campaign has been plagued by successive scandals since mid-May. As long as Lula appears to enjoy the upper hand, markets are likely to price a scenario of political status quo for Brazil and only a modest (if any) fiscal adjustment by a potential Lula 4.0 administration come January 2027. However, right-wing candidates should start gaining from early September as engagement rises, so investors will be watching closely for other challengers emerging other than Flavio Bolsonaro. For markets, the focus is firmly on Brazil’s post-election fiscal outlook, and the implications for asset performance are likely to be binary; even if a potential Lula 4.0 government signals some willingness to adjust spending, we believe investors would be skeptical that meaningful fiscal adjustment would follow. Conversely, if Flavio Bolsonaro or another right-wing candidate were to gain ground ahead of October, Brazilian assets will likely enjoy a significant tailwind on expectations of a market-friendly fiscal policy shift post-election.
Emerging Markets Technicals
Emerging Markets Flows
Source for graphs: Bloomberg, JPMorgan, Gramercy. As of July 31, 2026.
For questions, please contact:
Kathryn Exum, CFA ESG, Director, Co-Head of Sovereign Research, [email protected]
Petar Atanasov, Director, Co-Head of Sovereign Research, [email protected]
This document is for informational purposes only. The information presented is not intended to be relied upon as a forecast, research or investment advice, and is not a recommendation, offer or solicitation to buy or sell any securities or to adopt any investment strategy. Gramercy may have current investment positions in the securities or sovereigns mentioned above. The information and opinions contained in this paper are as of the date of initial publication, derived from proprietary and nonproprietary sources deemed by Gramercy to be reliable, are not necessarily all-inclusive and are not guaranteed as to accuracy. This paper may contain “forward-looking” information that is not purely historical in nature. Such information may include, among other things, projections and forecasts. There is no guarantee that any forecasts made will come to pass. Reliance upon information in this paper is at the sole discretion of the reader. You should not rely on this presentation as the basis upon which to make an investment decision. Investment involves risk. There can be no assurance that investment objectives will be achieved. Investors must be prepared to bear the risk of a total loss of their investment. These risks are often heightened for investments in emerging/developing markets or smaller capital markets. International investing involves risks, including risks related to foreign currency, limited liquidity, less government regulation, and the possibility of substantial volatility due to adverse political, economic or other developments. References to any indices are for informational and general comparative purposes only. The performance data of various indices mentioned in this update are updated and released on a periodic basis before finalization. The performance data of various indices presented herein was current as of the date of the presentation. Please refer to data returns of the separate indices if you desire additional or updated information. Indices are unmanaged, and their performance results do not reflect the impact of fees, expenses, or taxes that may be incurred through an investment with Gramercy. Returns for indices assume dividend reinvestment. An investment cannot be made directly in an index. Accordingly, comparing results shown to those of such indices may be of limited use. The information provided herein is neither tax nor legal advice. Investors should speak to their tax professional for specific information regarding their tax situation.