Contents
Market Overview
Macro Review
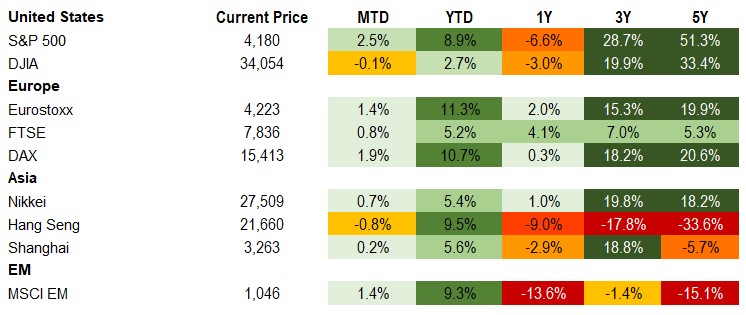
You might consider the Fed to be dovish, but recent data challenges that notion. The January payroll was exceptionally strong at 517k and significantly ahead of all economist forecasts with unemployment now at 3.4%. The ISM Services Index was also the strongest since June 2020 and came in well ahead of the survey. Suddenly, the biggest event of next week is when Fed Chair Powell will be interviewed by David Rubinstein at the Economic Club of Washington. Powell had stated the disinflationary process had started. Other than suggesting that ongoing increases will be data dependent, he had said that inflation had eased somewhat but remains elevated. The Fed hiked policy rates by 25bp to 4.25-4.75% and while the December SEP is still 5.1%, market pricing has fallen to 4.9% implying that a final 25bp in March could see the Fed pausing in May. The data releases on Friday immediately challenge that thesis. Irrespective of whether the Fed pause in May, June or July, Chair Powell barely pushed back on the idea of looser policy in 2H23 and repeatedly cited “disinflation”. He will undoubtedly be tested on these points in the weeks ahead as well the cohort of Fed speakers. Both the VIX and MOVE volatility indices had been in a tailspin lower and trended back down to March 2022 levels, which remains a theme of 2023 thus far. The ECB and BOE decisions on Thursday added further fuel to the rally, only to retreat on Friday. Both 10-year bunds and gilts rallied by significant margins, which was trigged by the BOE stating that the UK was turning the tide on inflation. It now looks increasingly likely that after the tenth consecutive interest rate hike, the BOE may end with a final 25bp hike rather than 50bp which was previously anticipated. The UK terminal rate has fallen from 4.5% to 4.3% after the policy increase to 4.0% over the past week. It wasn’t just G10 interest rates that rallied as the S&P struck a five-month high and the FTSE 100 reached an all-time high. In fact, the Nasdaq entered bull-market territory after rallying 20% off the lows set in late December. The data from Friday suggests there could be further upside in the near-term, with total call option volumes reaching their highest levels ever on Thursday. Elsewhere, Chinese PMIs were softer than expectations, but the IMF World Economic Outlook overshadowed this. The IMF projects global growth of 2.9% in 2023, which was revised up from 2.7% and inflation is now expected to halve in 2024. The major upward revisions in growth were for China (4.4% to 5.2%), the Euro-area (0.5% to 0.7%), Mexico (1.2% to 1.7%), Russia (-2.3% to +0.3%) and the U.S. (1.0 to 1.4%). The other major news event was the price action in the 10 Adani Group entities after the Hindenburg claim that the offshore shell entities were used to inflate revenues and manipulate stock prices.
EM Credit Update
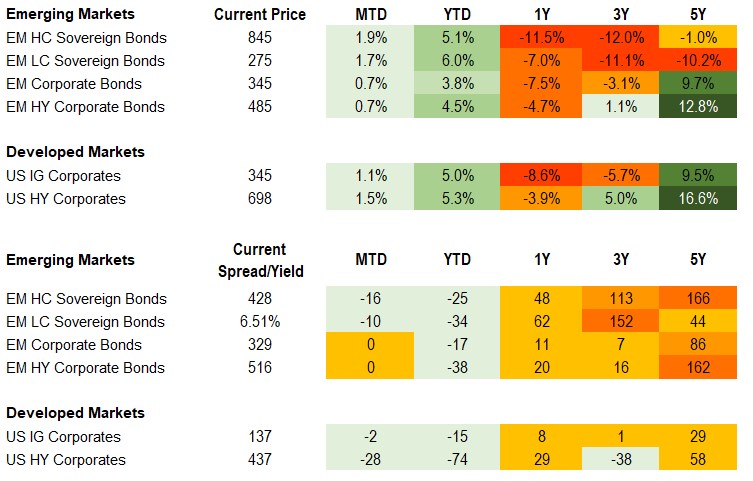
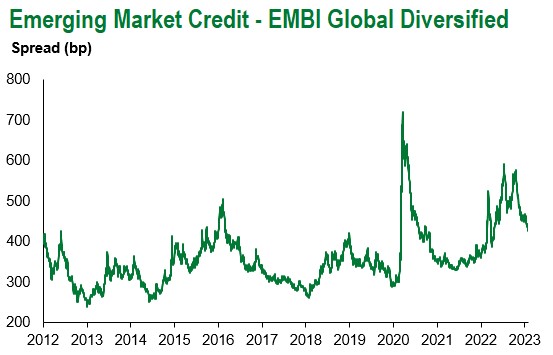
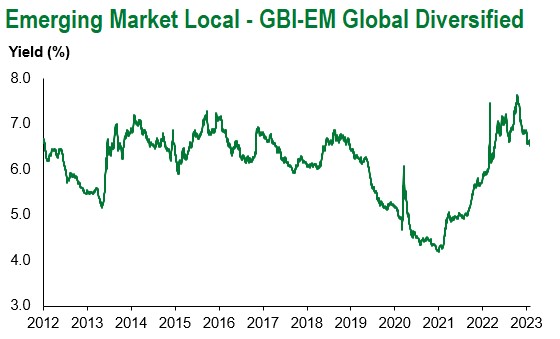
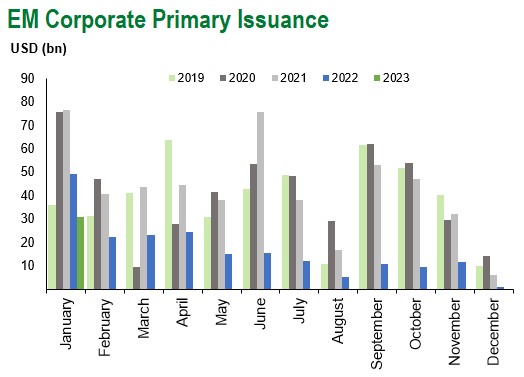
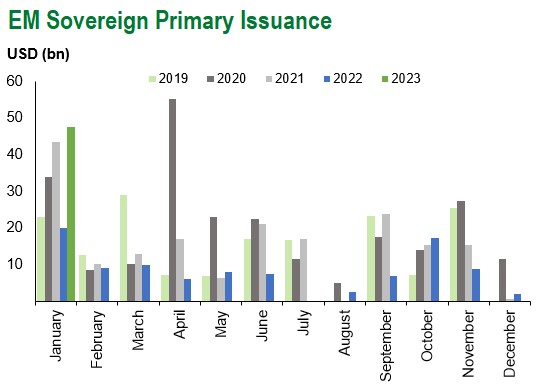
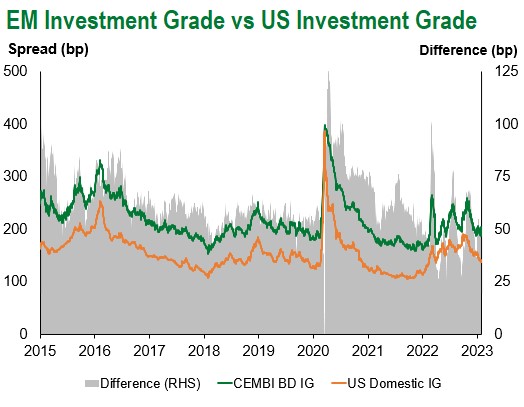
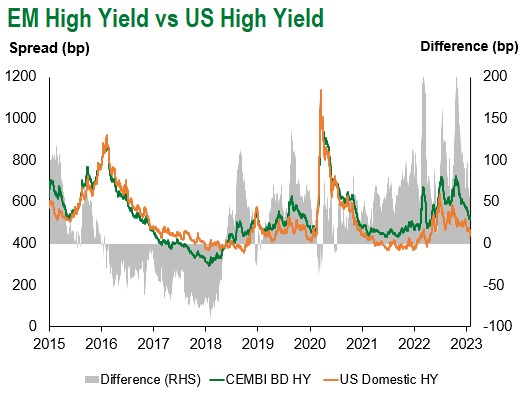
Emerging market sovereign credit (cash bonds) ended the week +1.3% with spreads 12bp tighter. EM credit spreads tightened this week with U.S. Treasuries also rallying 2-4bp wider. Sovereign outperformers over the week were Kazakhstan, Ecuador and Egypt, while Zambia, Tunisia and Ukraine underperformed. EM returns through January saw the EM Sovereign Index rally 3.2% and EM Corporate Index gain 3.0%, with the EM Local Currency Index jump 4.3%. For the most part, EM outperformed across global fixed income, but lagged DM equities with the S&P up 6.2% and Crypto up c.40%. Spreads across the EMBI HY, CEMBI HY and US HY were -26bp, -38bp and -46bp tighter, respectively. On top of that, U.S. Treasuries tightened -37-43bp with oil unchanged but copper was up 11.8% through January, which created a strong backdrop for risk markets. The best performance in EM is driven by Triple C bonds with sovereigns 289bp tighter and corporates that are 167bp tighter in spread.
The Week Ahead
It may be wishful thinking, but February was earmarked as the likely time-frame for selecting the next BOJ governor. The new governor will be an important barometer for G10 interest rates, insofar as the future of yield curve control. President Biden’s State of Union address could be equally headline grabbing. Next week will also see UK GDP, Eurozone retail sales and then Germany’s industrial production and inflation releases. Across EM, interest rate decisions are due from India (6.25%), Poland (6.75%) and Russia (7.5%). Inflation releases are also expected from Brazil, Chile, China, Mexico, Philippines and Thailand. Finally, there will also be GDP releases from Indonesia, Malaysia and Ukraine.
Highlights from emerging markets discussed below: Turkey’s Opposition Alliance parties unveil a memorandum of joint policies but have not agreed on a Presidential candidate yet and Lebanon’s FX devaluation not a game-changer for parallel economic and political crises.
Fixed Income
Equities
Commodities

Source for data tables: Bloomberg, JPMorgan, Gramercy. EM Fixed Income is represented by the following JPMorgan Indicies: EMBI Global, GBI-EM Global Diversified, CEMBI Broad Diversified and CEMBI Broad High Yield. DM Fixed Income is represented by the JPMorgan JULI Total Return Index and Domestic High Yield Index. Fixed Income, Equity and Commodity data is as of February 3, 2023 (mid-afternoon).
Emerging Markets Weekly Highlights
Turkey’s Opposition Alliance parties unveil a memorandum of joint policies but have not agreed on a Presidential candidate yet
Event: The “Nation Alliance”, Turkey’s main opposition block comprised of six political parties, published a joint document outlining the main policies the Alliance intends to pursue in the event they ascend to power in Presidential Elections scheduled for mid-May.
Gramercy commentary: The Joint Policy Memorandum, an extensive 250-page document listing various policy priorities for the opposition, is an important step in the direction of forming a viable political coalition ahead of the May 14 Presidential and Parliamentary elections. The economic policy priorities outlined in the document would be a dramatic departure from Turkey’s current distorted macroeconomic policy mix and a return to an orthodox economic framework. Such a post-election policy environment would be seen as strongly welcomed by markets. However, the critical question remains pending: would the opposition be able to produce a competitive joint candidate who can defeat President Erdogan in May and start translating market-friendly intentions into real world policy actions. There have been promising signals that the Nation Alliance’s leaders might be able to reach a deal on a united candidate by mid or late February, however, significant disagreements appear to remain lingering. Any delay beyond February or a failure to reach a compromise on a suitable name to face Erdogan would likely enhance the incumbent’s re-election chances amid a relatively stable macro environment in recent months and a barrage of pre-election populist measures by the Administration.
Lebanon’s FX devaluation not a game-changer for parallel economic and political crises
Event: Lebanon’s authorities announced a new official exchange rate of 15,000 Lebanese pounds (LBP) against the U.S. dollar in a large devaluation from the previous rate of 1,500 LBP that was in place since the 1990s.
Gramercy commentary: Although devaluing the currency has been one of IMF’s main recommendations for Lebanon, this step is highly unlikely to nudge the country closer to resolving economic and political turmoil in the absence of a complete political system reboot. The new official rate will be used for withdrawals from USD-denominated bank deposits in the bankrupt local bank system that are capped at around $1,600 equivalent per month, while the current black-market rate is around LBP 50,000 for US$1. From that perspective, the devaluation would have no meaningful impact on the overall macroeconomic environment. Easing Lebanon’s economic turmoil hinges on profound reforms to the country’s highly complex and dysfunctional political system but ability and/or willingness to implement change has proved limited despite a series of major economic and social shocks in recent years.
Emerging Markets Technicals
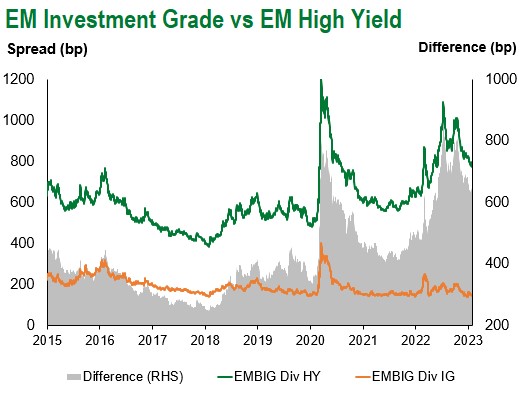
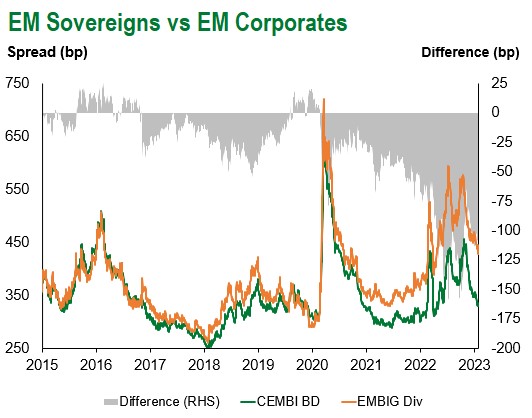
Emerging Markets Flows
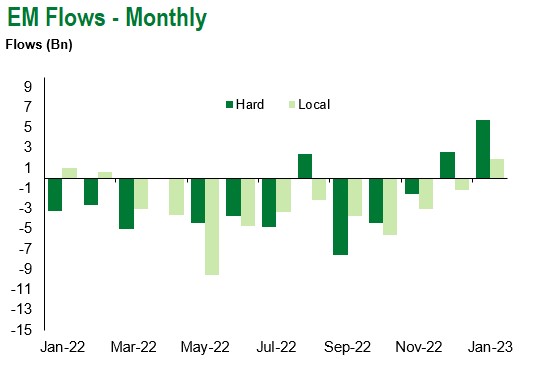
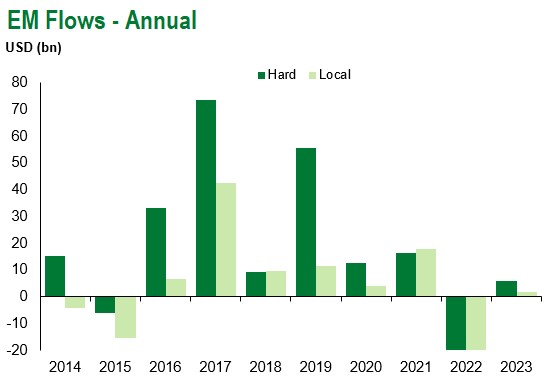
Source for graphs: Bloomberg, JPMorgan, Gramercy. As of February 3, 2023.
COVID Resources:
Johns Hopkins COVID-19 Case Tracker
For questions, please contact:
Kathryn Exum, CFA ESG, Director, Co-Head of Sovereign Research, [email protected]
Petar Atanasov, Director, Co-Head of Sovereign Research, [email protected]
James Barry, Director, Deputy Portfolio Manager, [email protected]
This document is for informational purposes only. The information presented is not intended to be relied upon as a forecast, research or investment advice, and is not a recommendation, offer or solicitation to buy or sell any securities or to adopt any investment strategy. Gramercy may have current investment positions in the securities or sovereigns mentioned above. The information and opinions contained in this paper are as of the date of initial publication, derived from proprietary and nonproprietary sources deemed by Gramercy to be reliable, are not necessarily all-inclusive and are not guaranteed as to accuracy. This paper may contain “forward-looking” information that is not purely historical in nature. Such information may include, among other things, projections and forecasts. There is no guarantee that any forecasts made will come to pass. Reliance upon information in this paper is at the sole discretion of the reader. You should not rely on this presentation as the basis upon which to make an investment decision. Investment involves risk. There can be no assurance that investment objectives will be achieved. Investors must be prepared to bear the risk of a total loss of their investment. These risks are often heightened for investments in emerging/developing markets or smaller capital markets. International investing involves risks, including risks related to foreign currency, limited liquidity, less government regulation, and the possibility of substantial volatility due to adverse political, economic or other developments. References to any indices are for informational and general comparative purposes only. The performance data of various indices mentioned in this update are updated and released on a periodic basis before finalization. The performance data of various indices presented herein was current as of the date of the presentation. Please refer to data returns of the separate indices if you desire additional or updated information. Indices are unmanaged, and their performance results do not reflect the impact of fees, expenses, or taxes that may be incurred through an investment with Gramercy. Returns for indices assume dividend reinvestment. An investment cannot be made directly in an index. Accordingly, comparing results shown to those of such indices may be of limited use. The information provided herein is neither tax nor legal advice. Investors should speak to their tax professional for specific information regarding their tax situation.
