

Executive Summary
A hawkish payrolls surprise headlined the week. August NFP tripled consensus at 162k, pushing September Fed hike market probability back above 60% and the 2Y yield to ~4.36% after a whipsaw week (10Y touched 4.82%). EM felt it from a duration perspective. All three sub-asset classes were modestly lower (hard currency sovereigns −0.22%, corporates −0.14%, local −0.05%), with IG underperforming HY and 10+ year paper (−0.48% in sovereigns) absorbing the losses while short-dated, higher-carry segments held flat — a global-yields move, not an EM credit repricing.
The resumed U.S.–Iran strike cycle re-anchored the geopolitical premium but distressed and oil-linked EM credit kept working. Strikes inside Hormuz, retaliation on Jordan and Gulf-ally bases, and the collapse of the corridor talks put Brent back to the mid-$90s. Within hard currency, Venezuela (+3.43%, on oil-deal progress), Angola, and Iraq led while the CCC bucket (+0.33%) was the only rating segment to gain. The energy tape and idiosyncratic recovery stories, not beta, drove returns this week.
Local markets showed the differentiation theme at its starkest, with politics and FX doing the work. A flat local index (−0.05%) masked wide dispersion: Brazil (+2.18%) rallied on opposition gains in election polling with the real contributing +1.43%, while Thailand (−2.22%, baht-led) was the clear laggard and currency was a headwind almost everywhere.
Market Overview
Macro Update
The August jobs report, released Friday morning, delivered the decisive data point for the week, which landed firmly on the hawkish side. Nonfarm payrolls rose 162k, the strongest monthly gain since March and roughly triple the 55k consensus, while July’s initial -23k print was revised up to +21k and the unemployment rate held at 4.1%. Wage pressures stayed contained, with average hourly earnings up 0.3% on the month and slowing to 3.1% YoY.
The reaction saw equity futures slip and short-end Treasury yields rise sharply as markets lifted the odds of a hike at the September 15–16 FOMC back to above 60% after the brief mid-week drop. For global markets, the report validates Chair Warsh’s “full employment” characterization and shifts the spotlight ahead of the September FOMC decision onto next Friday’s August CPI print.
The rest of the week’s U.S. data had painted a more ambiguous picture, which makes Friday’s upside surprise the more consequential. ADP private payrolls rose just 38k, the weakest of the year, JOLTS openings extended their downtrend, and the ISM services employment sub-index stayed in contraction at 47.8 even as ISM manufacturing printed a robust 54.6 and the S&P Global composite PMI hit a 20-month high of 56.0. The Fed’s internal debate also broke into the open: Governor Waller argued Thursday for holding rates in September, a dovish counter to Warsh’s Jackson Hole emphasis that briefly sank the dollar and lifted gold toward $4,500 per ounce.
The Middle East strike-for-strike cycle resumed after the prior week’s economic-warfare interlude. U.S. forces hit IRGC positions inside the Strait of Hormuz, prompting Iranian retaliation against technical infrastructure and aircraft positions at two U.S. bases in Jordan and extending it to U.S. Gulf allies. For investors, the collapse of the corridor-talks de-escalation track and the mining threat inside Hormuz re-anchor the geopolitical premium and the tail risk of energy-infrastructure strikes. Against this volatile backdrop, Brent regained the $90 handle on Monday’s escalation and closed in the mid-$90s.
Rates markets endured another turbulent week. The 10-year Treasury yield climbed to 4.82% on Wednesday—approaching its highest close since 2023—with the 30-year near 5.25% and the 2-year at 4.32%, before a sharp Thursday reversal as the yen surged and Governor Waller’s comments pulled yields lower across the curve; Friday’s payrolls beat then drove the short end back up, with the 2Y closing around 4.36%. For investors, the curve’s whipsaw with hawkish repricing at the front and fiscal-and-term-premium anxiety at the back keeps duration discipline paramount.
Currency markets produced the week’s most dramatic single move as JPY moved to below 158 vs USD, its strongest level in three weeks on suspected Bank of Japan “rate checks” that markets read as the prelude to further intervention. The DXY dollar index round-tripped—touching three-week highs near 99.6 mid-week before sliding on the Waller comments and yen strength. Coordinated official pushback at the 160+ level increasingly looks like a de facto line in the sand for the yen, which, at the margin, supports EM Asia currencies that trade in the yen’s gravitational field.
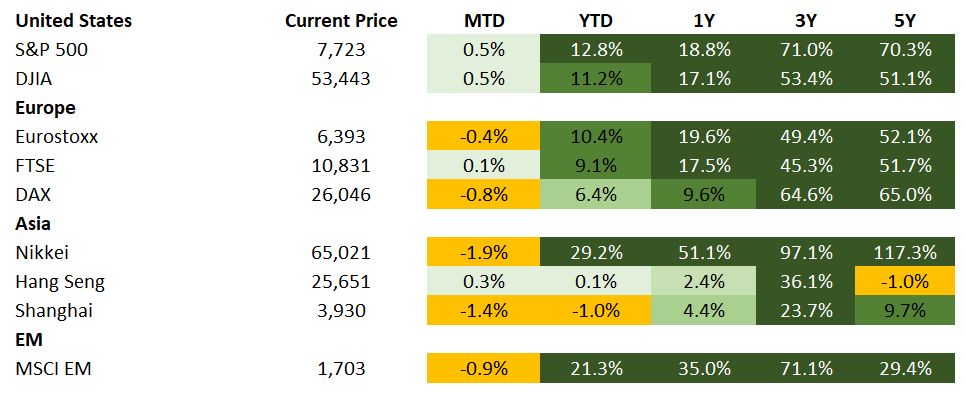
Equities broke a three-day losing streak as yields retreated mid-week, but the payrolls print sent them back lower. The AI complex delivered a mixed verdict: Broadcom beat estimates and guided above consensus, but the stock struggled as its outlook failed to clear the bar Nvidia set the prior week, while Snowflake jumped 16% on strong results and a new round of AI model releases that kept the theme’s momentum intact.
In Europe, the case for next week’s ECB hike hardened from both directions. Flash August inflation jumped to 3.3% YoY, the highest this year, as energy inflation surged to 14.3% on the Hormuz disruption—though core eased to 2.4% and services to 3.0%, keeping the underlying picture contained—and the final manufacturing PMI rose to 52.7, a four-year high with the strongest new orders since early 2022, evidence the industrial economy has so far shaken off the oil shock. Markets now fully price a 25bps hike to 2.50% at the September 10 meeting. For investors, the combination of an energy-driven headline spike and benign core argues the ECB delivers a “hike-and-wait” rather than the start of a genuine tightening cycle, a distinction that should cap the euro rates selloff and matters directly for CEE local markets priced off the ECB path.
China’s August PMIs split along ownership and export lines: the official manufacturing gauge contracted for a second month (with construction at cycle lows and services soft), while the private RatingDog survey, skewed toward smaller exporters, rose to 51.5 with export orders growing at the fastest pace in six months, lifting the composite to a two-month high. Factory-gate price sub-indices firmed on higher energy and metals costs even as domestic demand stayed weak. For investors, the divergence suggests China’s external engine is absorbing the global demand shock better than feared while the domestic economy still awaits delivery on the Politburo’s fiscal pledges — a mix that favors EM Asia exporters over China domestic-demand plays.
The Week Ahead
Two central bank set pieces dominate. The ECB meets September 10, where a 25bps hike to 2.50% is fully priced. The interest is in President Lagarde’s guidance on whether this is a one-off energy-shock response or the start of a path into restrictive territory, with direct implications for the euro and CEE rates. The following morning’s U.S. August CPI (Friday, September 11) is the final major input before the September 15–16 FOMC. After Friday’s payrolls blowout, a firm core print would likely cement the hike the short end has begun to price, while a soft one would leave a split Committee facing a genuinely live decision. The Treasury’s 3-, 10-, and 30-year auctions are the first substantial long-end supply since the buyback expansion and a key test of whether official support has genuinely stabilized term premium.
Geopolitically, the watch-points are whether the resumed U.S.-Iran strike cycle escalates toward energy infrastructure or further minelaying attempts inside the Strait of Hormuz, the durability of Gulf-ally airspace after the Jordan and Kuwait strikes, and any follow-through on secondary sanctions ahead of President Xi’s expected Washington visit—each capable of repricing crude abruptly in either direction. In EM, China’s August trade and inflation data will test the exporter-resilience thesis, Brazil and Mexico release inflation prints that frame their next policy meetings.
Highlights
U.S.-Venezuela oil deal boosts investor sentiment amid lingering political uncertainty
Event: President Trump announced that the U.S. had secured “majority control” over more than 65 billion barrels of Venezuelan reserves through a structure centered on Alejandro Betancourt’s North American Blue Energy Partners (NABEP), in which the U.S. government would take a 35% equity stake, buy 20% of output at cost, and hold a right of first refusal on the remaining 80%—an effective claim of roughly 55% of production. Venezuela frames it as a 25-year, 17-field development plan targeting more than $100 billion of investment and 1.5 million barrels per day of output, while U.S. reporting describes 100-year rights held via the Pentagon’s Office of Strategic Capital. A September 2 signing ceremony in Caracas, attended by U.S. Energy Secretary Wright, formalized project agreements with Chevron ($7 billion), ENI and other companies under the reformed Hydrocarbons Law’s new CPP framework. Separately, interim President Rodríguez and President Trump both said Venezuela is “not ready yet” for elections. VENZ and PDVSA bonds rallied roughly 3–3.5c on the headlines and sit near their May peaks.
Investment Implications: The rally reflects an improvement in sentiment: the deal reaffirms a durable U.S. commitment to Venezuela and the Western hemisphere, and the headlines have pushed bonds back toward their May peaks. For now, it is the signal, not the substance, that is doing the work—the deal does not change near-term production, which remains around 1.2 million barrels per day with only gradual gains likely, and the $100 billion figure is an aspirational multi-year requirement rather than committed capital. We note that at current rates, oil production has increased by approximately 50% since late 2025 levels (prior to Maduro’s extraction) but still sits well below its 2001 all-time peak (around3.0 million barrels per day). Two key questions remain on investors’ minds: 1) will higher oil production translate into higher sovereign repayment capacity and 2) will the U.S. Treasury’s likely role in an eventual workout subordinate existing bondholders. “Not ready yet” rhetoric from Caracas and Washington underscores the political question hanging over all of it. We read the deal as directionally constructive and putting a floor under headline risk, but with ultimate recovery-value prospects hinging on the unresolved political transition. Amid likely increasing U.S. investment flowing into Venezuela’s hydrocarbons production, the key question for creditors will be how much of the cash flow will reach the sovereign balance sheet and under what kind of government.
Market Data
EM Credit Update
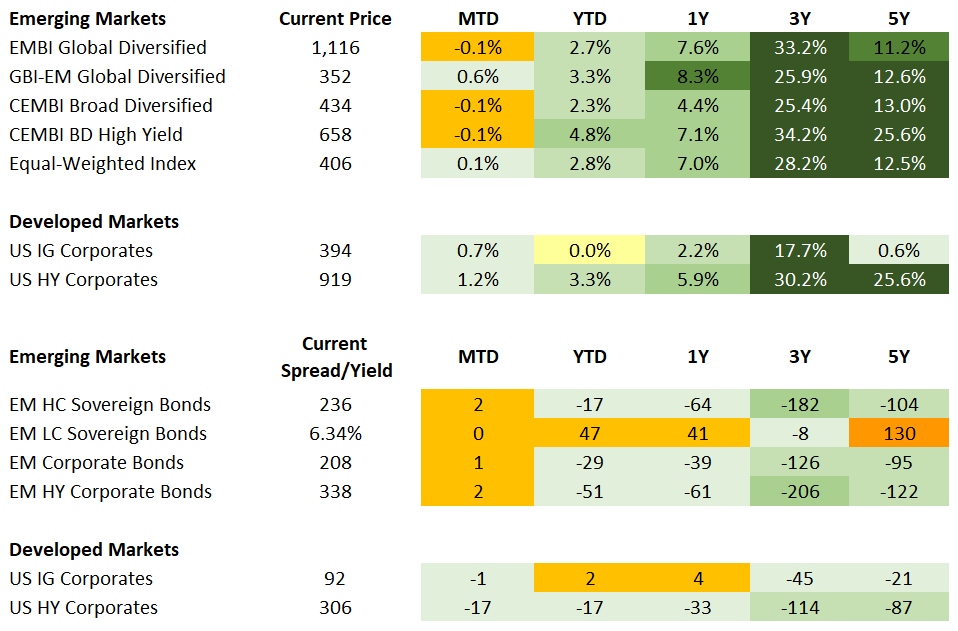
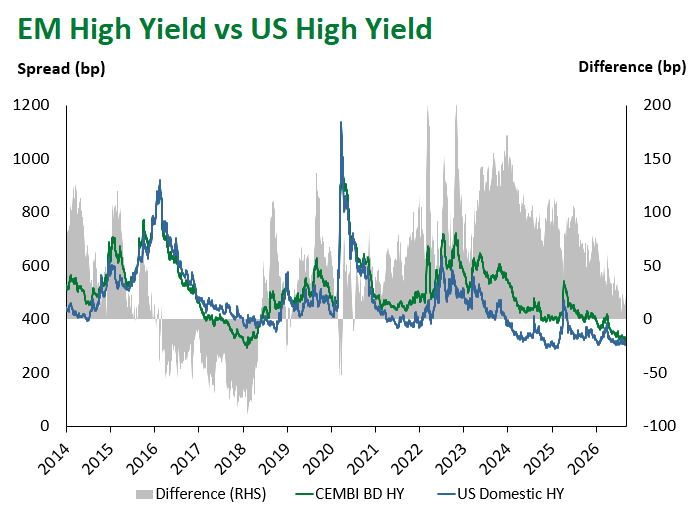
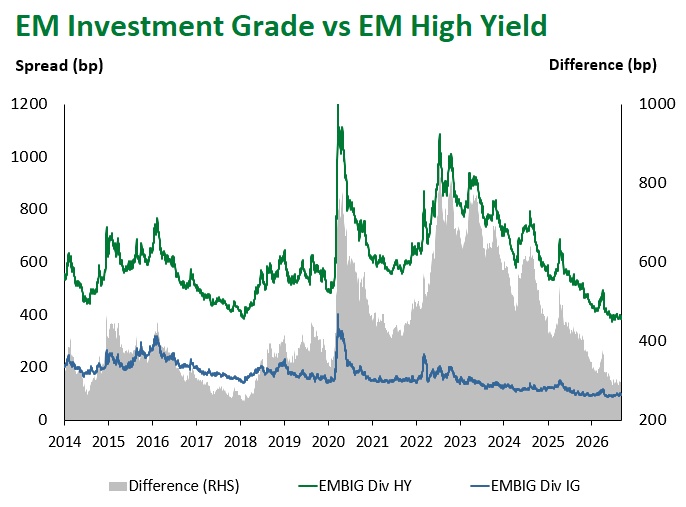
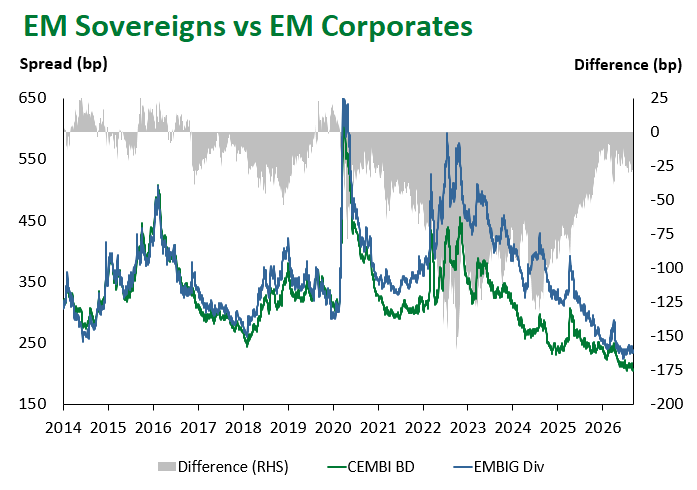
Emerging Markets (EM) fixed income was modestly lower across all three sub-asset classes this week. Hard currency sovereigns returned -0.22%, EM corporates -0.14%, and local currency sovereign debt was marginally negative at -0.05%. The composition of returns points to rates rather than credit as the dominant driver. In both hard currency indices, performance deteriorated steadily as duration extended, and investment grade underperformed high yield. Shorter-duration, higher-carry segments held their ground while longer-duration, higher-quality paper absorbed the losses, a pattern consistent with a move in global yields rather than any broad repricing of EM credit risk.
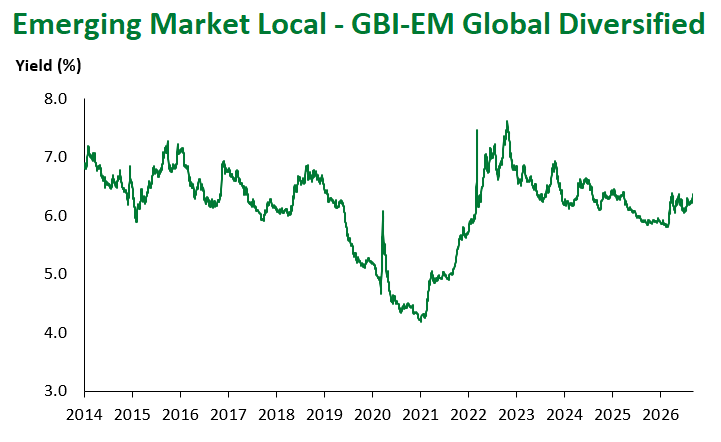
Local currency sovereign debt returned -0.05%, with a flat index level masking unusually wide dispersion. Latin America (+0.33%) was the only region to advance, carried almost entirely by Brazil (+2.18%), where a strong real contributed +1.43% of the total alongside a positive price leg. The move followed polling that showed the opposition narrowing the gap ahead of the election, which investors read as a constructive shift in the political outlook. The Middle East and Africa (-0.44%) and Europe (-0.39%) lagged, while Asia (-0.06%) was broadly flat. India (+0.77%), Hungary (+0.53%) and Türkiye (+0.48%) also gained, though Türkiye’s return came entirely from carry (+0.53%) against a weaker lira, and China (+0.16%) eked out a small positive. Thailand (-2.22%) was the clear laggard by a wide margin, followed by Chile (-0.82%), the Czech Republic (-0.81%), Indonesia (-0.79%) and Poland (-0.64%). Currency was a headwind in the large majority of markets, with the Thai baht (-1.69%) the weakest by some distance, and price returns were negative across most of the index.
Hard currency sovereign bonds returned -0.22%, with investment grade (-0.36%) underperforming high yield (-0.08%). Regionally, Africa (-0.06%) and Latin America (-0.11%) were the relative outperformers, while Europe (-0.41%) and Asia (-0.33%) lagged, with the Middle East in between (-0.29%). At the country level, Venezuela (+3.43%) extended its run and remained the strongest performer, supported by progress on oil deals, followed by Angola (+0.80%), Argentina (+0.76%) and Iraq (+0.24%). Paraguay (-0.98%), Ukraine (-0.94%), Colombia (-0.81%), Ecuador (-0.65%) and Poland (-0.65%) were the weakest. By rating, the CCC bucket (+0.33%) was the only segment to post a meaningful gain, while single-A (-0.38%) and BBB (-0.36%) credits lagged. Across the curve, the 1-3 year bucket returned +0.23% against -0.48% for 10+ year maturities.
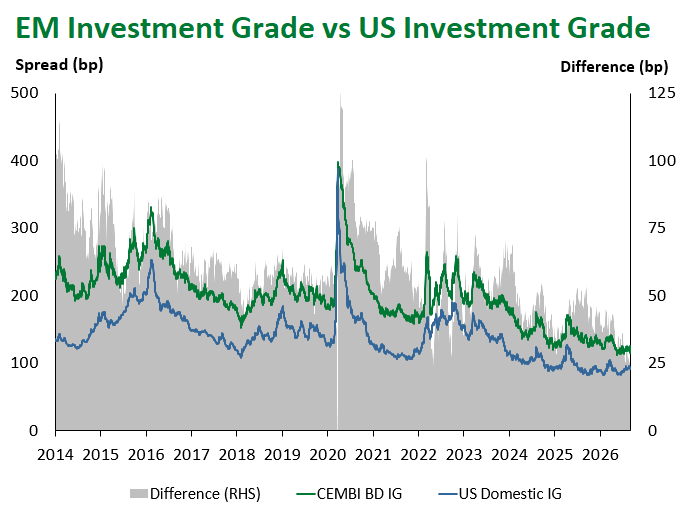
EM corporates returned -0.14%, with investment grade (-0.17%) modestly behind high yield (-0.09%) and the same duration pattern in evidence: the 1-3 year segment was broadly flat at -0.02% versus -0.35% for the 10+ year bucket. Regionally, Africa (-0.06%) and Europe (-0.08%) held up best, while the Middle East (-0.22%) and Latin America (-0.17%) lagged. Ghana (+0.30%), Iraq (+0.28%), Bahrain (+0.26%) and Georgia (+0.24%) led at the country level, while Ukraine (-0.69%) and Israel (-0.60%) were the weakest, followed by Colombia (-0.44%), Kazakhstan (-0.36%) and Saudi Arabia (-0.35%). By rating, the C bucket (-1.01%) stood out as the clear laggard, an outsized move relative to the rest of the index, while AAA and single-B credits were essentially unchanged at -0.01% each.
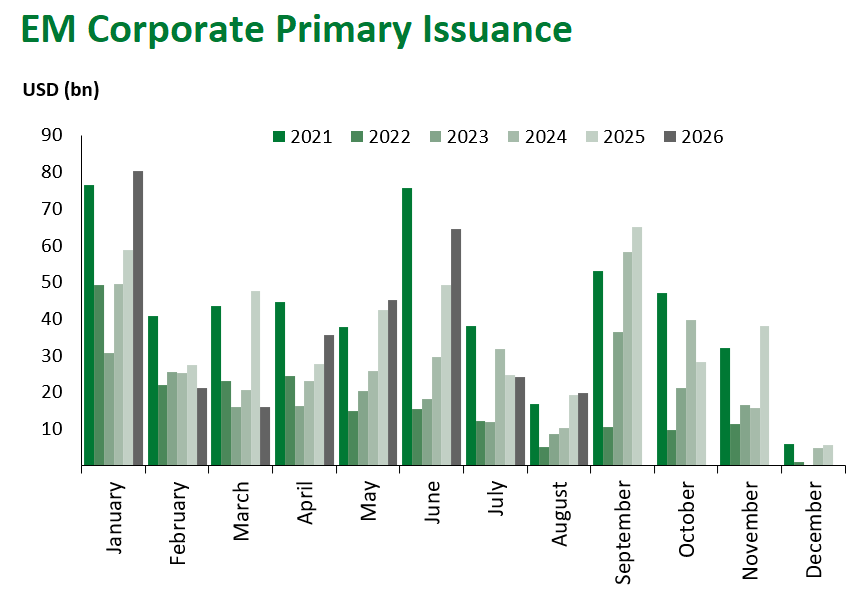
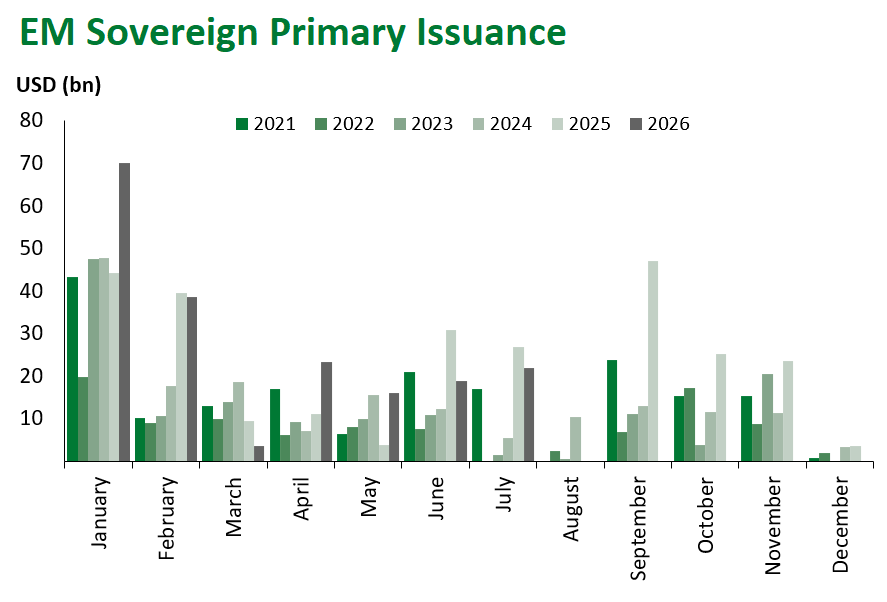
Primary market activity was robust, with 16 issuers pricing approximately $18.4 billion of hard currency supply across 22 tranches, split roughly evenly between CEEMEA and Asia and with no supply from Latin America or Africa. Investment grade accounted for close to three quarters of volume. Saudi Arabia was the largest borrower, raising $3.25 billion across a dual-tranche sukuk, while Pakistan returned with $3 billion in two tranches at yields of 7.75% and 8.25%. Bank capital was a notable theme, with Arab National Bank and Bank Mandiri each pricing $750 million AT1 perpetuals and Al Rajhi placing a $600 million Tier 2 sukuk. Euro-denominated issuance totaled roughly $2 billion equivalent, all of it covered bonds from Ceska Sporitelna, Israel Discount Bank and UniCredit Czech Republic & Slovakia.
Fixed Income
Equities
Commodities

Source for data tables: Bloomberg, JPMorgan, Gramercy. EM Fixed Income is represented by the following JPMorgan Indicies: EMBI Global, GBI-EM Global Diversified, CEMBI Broad Diversified and CEMBI Broad High Yield. DM Fixed Income is represented by the JPMorgan JULI Total Return Index and Domestic High Yield Index. Fixed Income, Equity and Commodity data is as of September 4, 2026 (mid-day).
Emerging Markets Flows
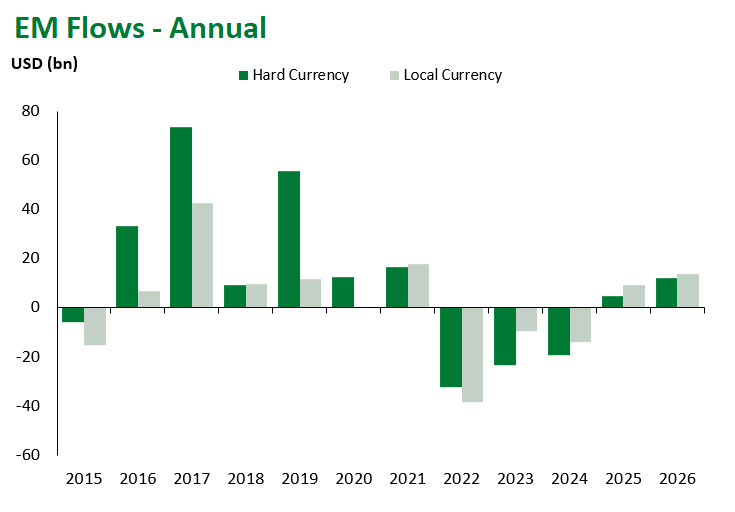
Source for graphs: Bloomberg, JPMorgan, Gramercy. As of September 4, 2026.
For questions, please contact:
Kathryn Exum, CFA ESG, Director, Co-Head of Sovereign Research, [email protected]
Petar Atanasov, Director, Co-Head of Sovereign Research, [email protected]
This document is for informational purposes only. The information presented is not intended to be relied upon as a forecast, research or investment advice, and is not a recommendation, offer or solicitation to buy or sell any securities or to adopt any investment strategy. Gramercy may have current investment positions in the securities or sovereigns mentioned above. The information and opinions contained in this paper are as of the date of initial publication, derived from proprietary and nonproprietary sources deemed by Gramercy to be reliable, are not necessarily all-inclusive and are not guaranteed as to accuracy. This paper may contain “forward-looking” information that is not purely historical in nature. Such information may include, among other things, projections and forecasts. There is no guarantee that any forecasts made will come to pass. Reliance upon information in this paper is at the sole discretion of the reader. You should not rely on this presentation as the basis upon which to make an investment decision. Investment involves risk. There can be no assurance that investment objectives will be achieved. Investors must be prepared to bear the risk of a total loss of their investment. These risks are often heightened for investments in emerging/developing markets or smaller capital markets. International investing involves risks, including risks related to foreign currency, limited liquidity, less government regulation, and the possibility of substantial volatility due to adverse political, economic or other developments. References to any indices are for informational and general comparative purposes only. The performance data of various indices mentioned in this update are updated and released on a periodic basis before finalization. The performance data of various indices presented herein was current as of the date of the presentation. Please refer to data returns of the separate indices if you desire additional or updated information. Indices are unmanaged, and their performance results do not reflect the impact of fees, expenses, or taxes that may be incurred through an investment with Gramercy. Returns for indices assume dividend reinvestment. An investment cannot be made directly in an index. Accordingly, comparing results shown to those of such indices may be of limited use. The information provided herein is neither tax nor legal advice. Investors should speak to their tax professional for specific information regarding their tax situation.