

Executive Summary
Warsh’s guidance-free Jackson Hole debut landed hawkish. His statement suggested that price pressures are the Fed’s “predominant focus” while refusing rate-path guidance; markets repriced September hike odds to around 60% and the treasury curve’s short end widened by as much as 10bps, with focus ahead of the September 15–16 decision now shifting to next Friday’s August jobs report.
Sticky inflation, but a bullish AI reset. July core PCE stalled at 3.3%, while real spending went flat, a stagflationary tinge; yet Nvidia’s comprehensive beat drove shares up 8.7% and the S&P 500 to its best session of the month, easing investor concerns in the capex-versus-monetization debate.
Iran pressure pivoted to economic warfare. “Operation Economic Outcast” designated ~60 entities but spared Chinese banks, leaving secondary sanctions as the binary risk into Xi’s late-September Washington visit; the Treasury named five target categories, or “lifelines”, shipping, digital assets, gold, aviation, and technology, allowing potential designation risk to be mapped by specific EM jurisdiction.
Market Overview
Macro Update
Chair Warsh delivered his first Jackson Hole keynote on Friday morning, breaking with two decades of tradition by declining to signal the policy path. In prepared remarks, he said the economy is at “full employment” while inflation figures “are more concerning,” concluding that “the Fed’s predominant focus right now should be on prices”, a slightly hawkish tilt in emphasis, while leaving investors to determine for themselves when the Committee would act. Markets did interpret Warsh’s comments on the hawkish side, repricing the implied probability of a September rate hike to around 60% while the short end of the U.S. Treasuries curve widened by as much as 10bps. The benchmark 10Y yield was less impacted, still around 3bps lower compared to last week at ~4.70%.
Coming after a week in which bond and dollar markets were described as “on edge” ahead of the address, and with the dollar near a one-week high into the speech, the remarks reinforce the new regime: a Fed biased toward tightening but withholding forward guidance. For investors, the absence of a rate-path steer keeps an elevated uncertainty premium embedded in U.S. rates and the dollar, with the focus ahead of the September 15–16 decision shifting to next Friday’s August jobs report.
Wednesday’s July PCE report strengthened the case for that hawkish emphasis. Headline PCE held at 3.7% YoY, above the 3.6% consensus, with prices up 0.2% on the month, while core PCE printed 3.3% for a second straight month—leaving the Fed’s preferred core gauge stuck in a 3.3–3.4% band for four consecutive months with essentially no net progress. More troubling for the growth side of the ledger, inflation-adjusted consumer spending was flat in July, a sharp deceleration from June’s 0.4% gain, as households retrenched against still-elevated prices. For investors, the report carried a stagflationary tinge. Sticky inflation alongside stalling real consumption narrows the Fed’s room for error and validates the market’s reluctance to price a quick resolution in either direction.
The AI trade received its most important data point since the spring. Nvidia’s results on Wednesday evening were a comprehensive beat. Revenue of $96.2 billion rose 106% YoY, EPS more than doubled, and guidance of $106–110 billion for the current quarter exceeded estimates. Shares jumped 8.7% on Thursday, driving the Nasdaq up 1.6% and the S&P 500 to its best session of the month after chip weakness had dragged indices lower early in the week. For investors, supplier-level evidence that AI capex is both accelerating and monetizing resets the capex-versus-monetization debate in the bulls’ favor with memory-cost inflation now the emerging watch-item across the complex.
Meanwhile, the Trump administration unveiled “Operation Economic Outcast,” the promised sanctions offensive against Iran. Roughly 60 entities, individuals, and vessels were designated, including some in mainland China and Hong Kong, across newly targeted sectors spanning digital assets, technology, gold, aviation, and shipping, aimed at a shadow-fleet network operating through the UAE, Hong Kong, China, Singapore, Switzerland, and Europe. Critically, the package stopped short of designating major Chinese banks that facilitate Iranian oil purchases, with Treasury Secretary Bessent saying countries would be given “the opportunity to remedy bad behavior” while warning that “no one is above the reach of U.S. sanctions.” Beijing vowed “all necessary measures” to protect its interests, and Tehran promised a “seismic” response while its central bank dismissed the measures’ incremental impact. For investors, the market read the package as a warning shot rather than a decisive blow, but the unresolved question of secondary sanctions on Chinese financial institutions is now the key binary risk for EM trade and financial channels heading into President Xi’s late-September visit to Washington.
Crude fell sharply despite the sanctions escalation and Hormuz throughput near post-war lows. Brent declined roughly 5% on the week to the high-$80s, with WTI near $83, as markets interpreted the pivot from military strikes to economic coercion as less immediately supply-disruptive. That reading was reinforced by a State Department decision to return evacuated diplomats to the region and by reports that Iran and Oman discussed a “temporary joint maritime corridor” through the Strait, with technical talks continuing toward a permanent arrangement. For investors, the geopolitical premium is deflating on diplomatic process rather than restored physical flows, leaving crude asymmetrically exposed to any breakdown in the corridor talks.
The Treasury market found a calmer footing after the prior week’s turmoil. Yields fell early in the week alongside oil and on a report that the Treasury could tap its roughly $850 billion General Account to fund expanded buybacks. The 10-year was little changed after the PCE print, holding below the prior week’s highs, and the 30-year dropped below 5.20% as the curve flattened. Pushback against the intervention strategy grew louder. However, Stanley Druckenmiller warned that liquidity tools cannot fix solvency problems, and JPMorgan analysts cautioned that the Treasury moving away from its “regular and predictable” issuance tenet risks embedding permanently higher risk premia. For investors, the long end has stabilized but not healed. Term premium remains the wildcard discount rate for global assets, and next week’s supply calendar is the next test.
A second trade front opened in North America. U.S.-Canada negotiations collapsed at the final stage over the weekend, prompting Ottawa to impose retaliatory tariffs of up to 50% on roughly $20 billion of U.S. goods after Washington’s move to raise duties on Canadian cars and parts. For investors, an open trade conflict with a top three U.S. trading partner adds a fresh cost-push channel to an inflation picture that July’s PCE showed is already sticky, and further complicates the Fed’s calculus.
In Europe, the data continued to surprise firmer, with German 2Q growth revised higher and the Ifo business climate index reaching a one-year high, keeping the ECB’s September 10 decision live for the hike that markets have priced. In EM, the week’s central bank decisions deepened the differentiation theme. The Bank of Korea hiked 25bps to 3.00% in a 6–1 vote, its second consecutive increase. The central bank also raised its 2026 growth forecast to 3.3% and upgraded its core inflation projections, with the won near its strongest levels in a year, EM Asia’s clearest entrant yet into the global tightening turn. Hungary’s MNB moved the opposite direction, cutting 25bps to 5.50% in a third straight reduction with July inflation at just 1.2%, though Governor Varga stressed vigilance given Middle East risks and warned that the high global yield environment poses capital-outflow risks for emerging markets. For investors, the widening dispersion between EM hikers with hot growth and disinflation outliers still easing, argues for country selection over index beta in local markets.
The Week Ahead
The August U.S. jobs report on Friday is the decisive release of the inter-meeting period, landing 12 days before the September 15–16 FOMC with hike-or-hold pricing still unsettled after Warsh’s guidance-free Jackson Hole debut. Following a run of sub-100k payroll prints and heavy downward revisions, a firm number would embolden the hawks while further labor-market softening would sharpen the Fed’s stagflationary dilemma. ISM manufacturing and services, JOLTS, ADP, and the Beige Book fill out the U.S. calendar. In China, official and RatingDog PMIs will show whether stimulus pledges are stabilizing activity, while eurozone flash August inflation frames the ECB’s September 10 meeting and 2Q GDP prints are due across several major EMs. Geopolitically, follow-through on the Iran sanctions package is the watch-point. Any move toward designating Chinese financial institutions or, conversely, visible “quiet diplomacy” ahead of President Xi’s late-September Washington visit, will determine whether the economic-warfare phase stays contained or broadens into a U.S.-China confrontation. For investors, the week will test whether August’s twin supports, resilient AI earnings and deflating oil, can carry risk assets through a September dense with binary events.
Highlights
U.S. sanctions risk for EM
Amid efforts to increase economic pressure on Iran’s regime, the U.S. Treasury earlier this week announced “Operation Economic Outcast”, extending secondary sanctions from entity-level designations to jurisdiction-level pressure on governments hosting Iran’s remaining financial and logistical infrastructure. The Treasury named five target categories, or “lifelines”, shipping, digital assets, gold, aviation, and technology, allowing potential exposure/risk to be mapped by specific EM jurisdiction.
Türkiye screens as the most credit-relevant single name, appearing in three of the five lifelines (digital assets, gold, and technology), in addition to its reliance on Iranian gas imports. Principal host jurisdictions across the categories span the shipping-registry states (Cameroon, Panama, Gabon, Barbados), the conduit and transshipment layer (UAE, Iraq, Malaysia, Singapore, Indonesia, Russia), and the dual-use technology re-export chain (China, Hong Kong, Central Asia).
We would frame the designation risk in four tiers. Tier 1 comprises the structurally unavoidable stories, namely China, Hong Kong, and Türkiye; however, we note that broader geopolitical considerations (China and Türkiye) and excellent bi-lateral relations between the administrations (Türkiye) likely limit the sanctions risk for these economies beyond specific entities doing business with Iran. We put the conduit and transshipment layer where we find the likes of UAE, Iraq, Malaysia, Singapore, Indonesia, and Russia as Tier 2, but also expect various factors to constrain higher-level risks beyond entity-level exposure. Tier 3 jurisdictions such as Cameroon, Panama, Gabon, and Barbados represent the softest targets, where the Treasury could show fast results at low diplomatic costs. Cameroon stands out within this group as the second-largest registry worldwide for sanctioned shadow-fleet tankers after Russia, accounting for 13% of sanctioned tankers broadcasting a flag in 2026. Overall, market relevance of Tier 3 countries is limited. Finally, in Tier 4 we put jurisdictions that have linkages via one or more of the Treasury’s Iran lifelines. However, such linkages are offset by strong competing U.S. interests. For example, Oman and Qatar are mediators, India is a strategic partner, and Central Asia and the Caucasus are the displacement zone absorbing rerouted flows from the Middle East.
Market Data
EM Credit Update
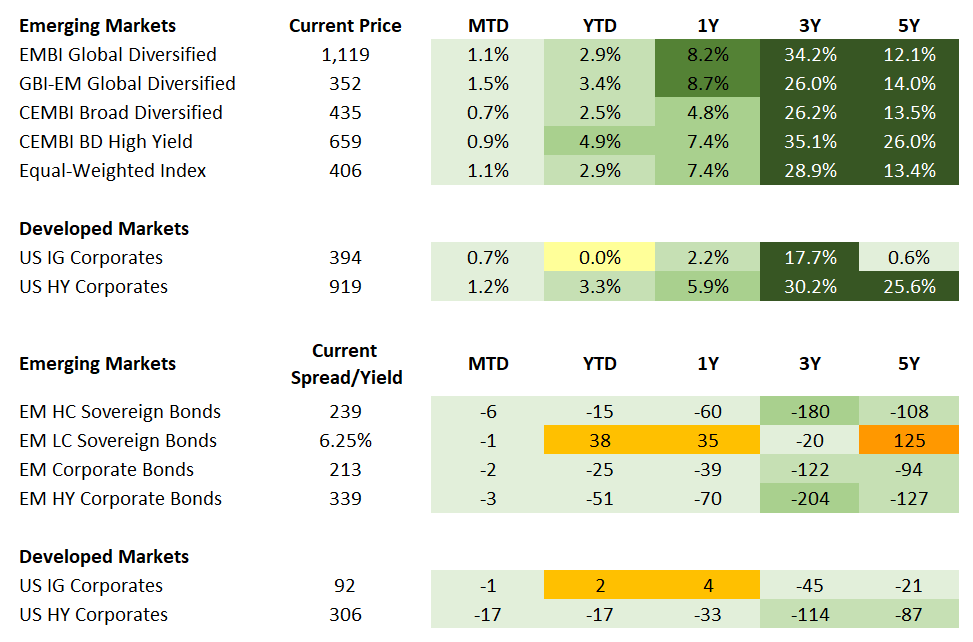
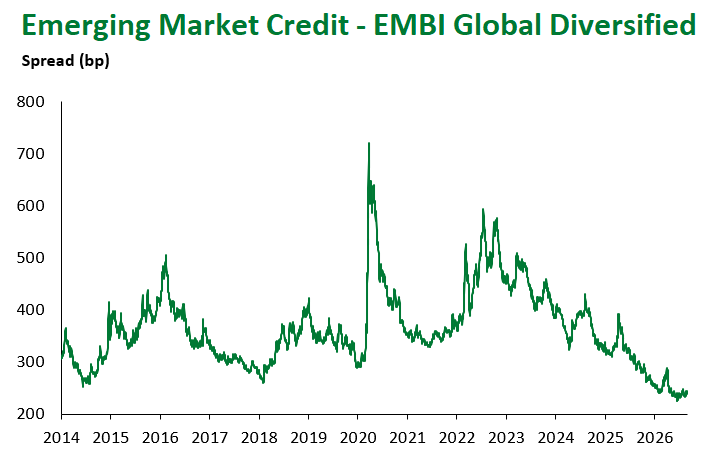
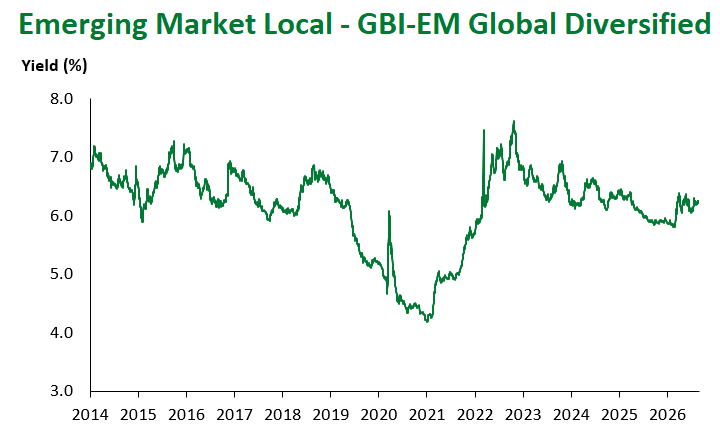
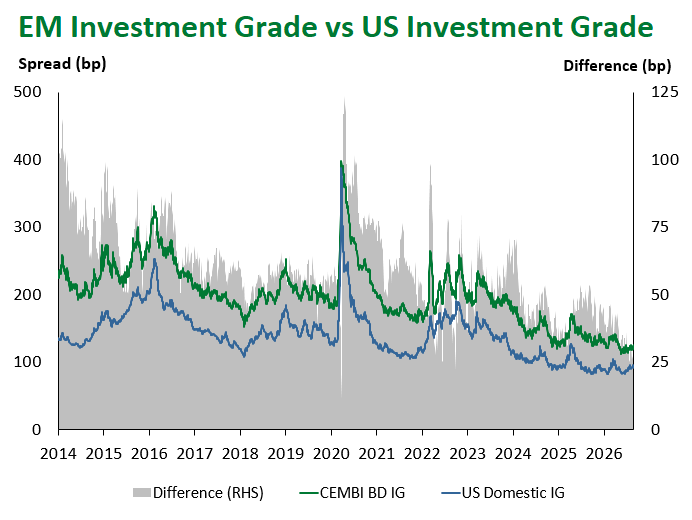
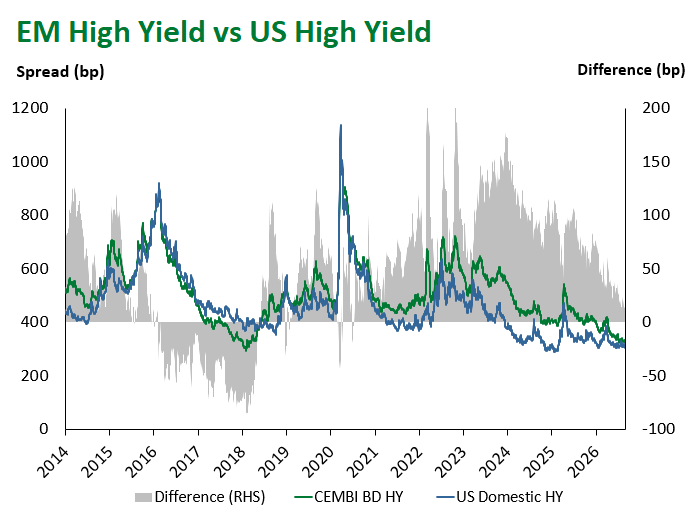
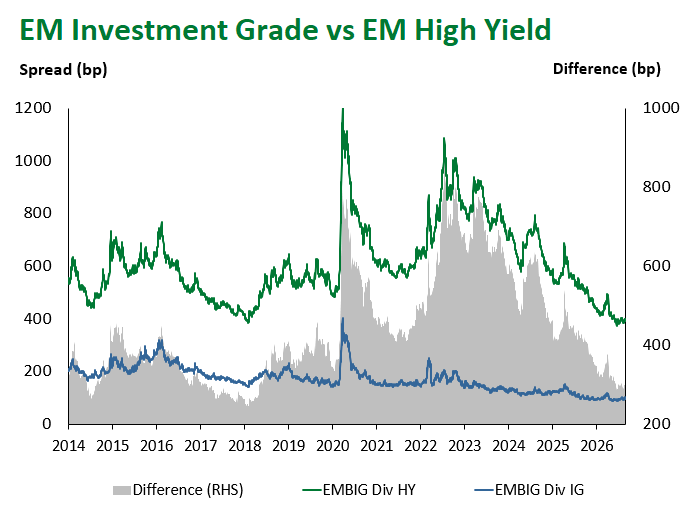
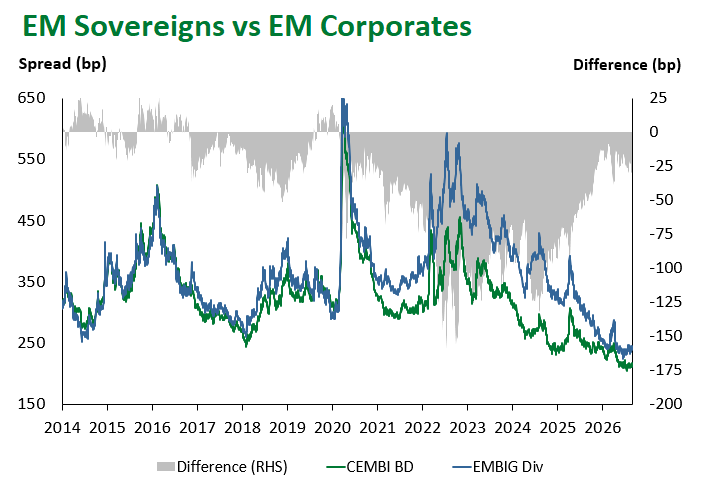
Emerging markets fixed income delivered mixed performance this week, with hard currency outperforming and local currency the only sub-asset class in negative territory. Hard currency sovereigns returned +0.48% at the index level and EM corporates gained +0.19%, while local currency sovereign debt declined -0.26% in USD terms. Dispersion was pronounced beneath the index level, with distressed and recovery-story credits driving much of the hard currency gain and a sharp move in Colombia weighing disproportionately on local markets.
Local currency sovereign debt underperformed, returning -0.26%. Colombia (-3.10%) was by a wide margin the weakest market, driven almost entirely by currency weakness (-2.68% FX contribution) alongside a negative price move. Central and Eastern Europe also lagged, with the Czech Republic (-0.56%), Poland (-0.55%), Hungary (-0.54%), and Romania (-0.41%) all posting losses on softer local currencies. At the other end, Egypt (+1.76%) led performance for a second consecutive period, followed by South Africa (+1.58%), Türkiye (+1.25%), and Brazil (+1.19%). The composition of those gains differed materially. South Africa and Egypt benefited from a combination of currency appreciation and price gains, while Türkiye’s return was almost entirely price-driven (+1.63%) against a modest FX drag, and Brazil’s came predominantly from duration.
Hard currency sovereign bonds rose +0.48%, with high yield (+0.50%) marginally ahead of investment grade (+0.45%). Regionally, Latin America (+0.65%) and the Middle East (+0.54%) led, while Africa (+0.28%) and Asia (+0.35%) lagged. Country-level performance was concentrated in distressed and event-driven credits: Venezuela (+2.89%) extended its run, followed by Ukraine (+1.79%), Lebanon (+1.28%), Ecuador (+1.13%), and Mozambique (+0.92%). The weakest performers were Angola (-0.86%), Bolivia (-0.63%), Senegal (-0.49%), and Gabon (-0.41%). By rating, the CCC bucket (+1.11%) meaningfully outperformed, while single-B credits (+0.33%) were the laggard, underscoring that the week’s high yield gain was narrow rather than broad-based. Along the curve, longer duration outperformed, with the 10+ year segment returning +0.73% against +0.27% for the 3–5-year bucket.
EM corporates advanced +0.19%, with investment grade (+0.22%) outperforming high yield (+0.14%), the reverse of the sovereign pattern. Regional performance was tightly clustered, with Africa (+0.24%) and Latin America (+0.23%) at the top and Europe (+0.14%) and Asia (+0.16%) at the bottom. At the country level, Trinidad & Tobago (+0.81%), Costa Rica (+0.61%), and Jamaica (+0.48%) led, while Ukraine (-0.83%) was the clear underperformer, a notable divergence from the +1.79% return in Ukrainian hard currency sovereigns over the same week. Hungary (-0.11%), Israel (-0.09%), and Nigeria (-0.08%) also finished slightly lower. By rating, the C bucket (-0.90%) was the only segment in negative territory, reflecting the Ukraine move, while BBB (+0.23%) led. Longer-dated paper again outperformed, with the 10+ year segment returning +0.36% versus +0.08% for the 1–3-year bucket.
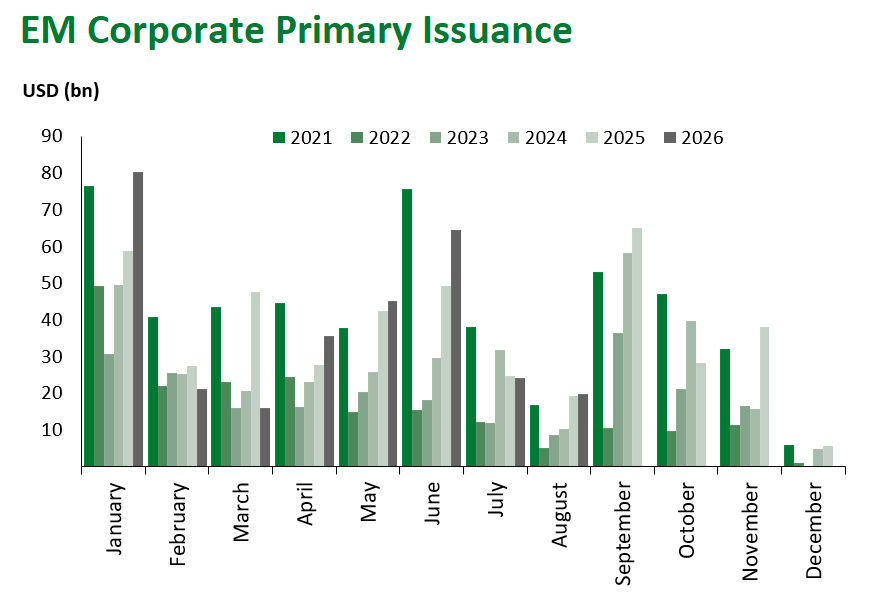
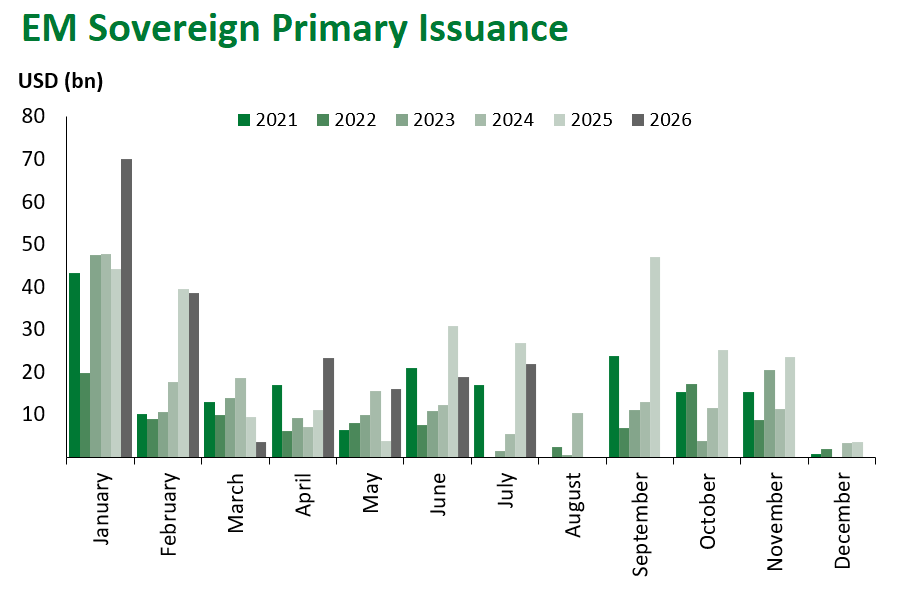
Primary market activity was steady but entirely investment grade, with ten issuers pricing approximately $8.6 billion equivalent in hard currency supply, roughly half of it euro denominated. Mexico was the only sovereign borrower, printing a four-tranche JPY deal of approximately $1.8 billion equivalent at yields of 3.16% to 5.49%, with three of the four tranches pricing wider than initial talk. Financials accounted for most of the balance, including ICICI Bank, Union Bank of India, Bank Leumi, and United Overseas Bank, alongside labeled supply from Korea Housing Finance Corporation (social) and PKO Bank Polski (green).
Fixed Income
Equities
Commodities
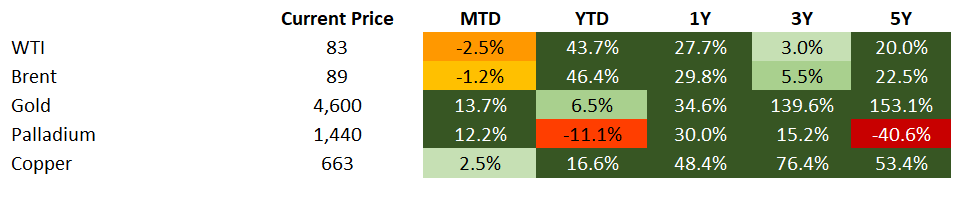
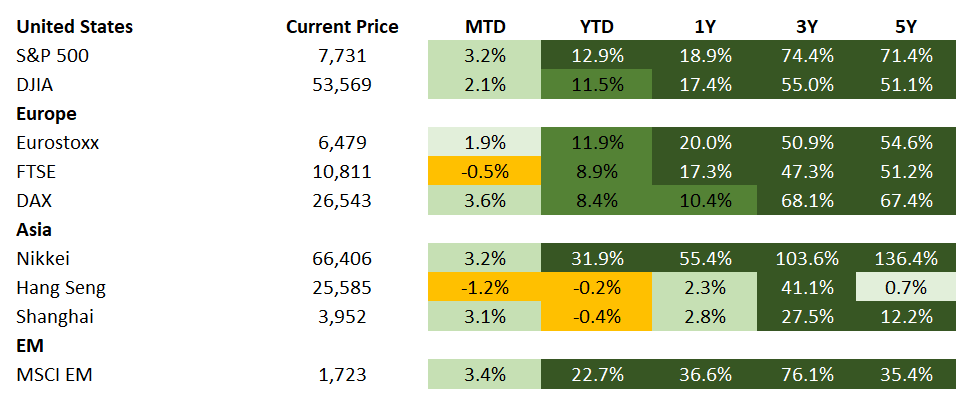
Source for data tables: Bloomberg, JPMorgan, Gramercy. EM Fixed Income is represented by the following JPMorgan Indicies: EMBI Global, GBI-EM Global Diversified, CEMBI Broad Diversified and CEMBI Broad High Yield. DM Fixed Income is represented by the JPMorgan JULI Total Return Index and Domestic High Yield Index. Fixed Income, Equity and Commodity data is as of August 28, 2026 (mid-day).
Emerging Markets Flows
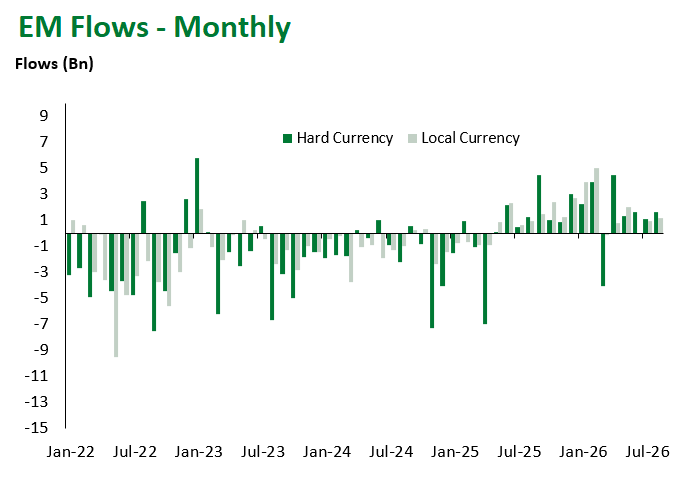
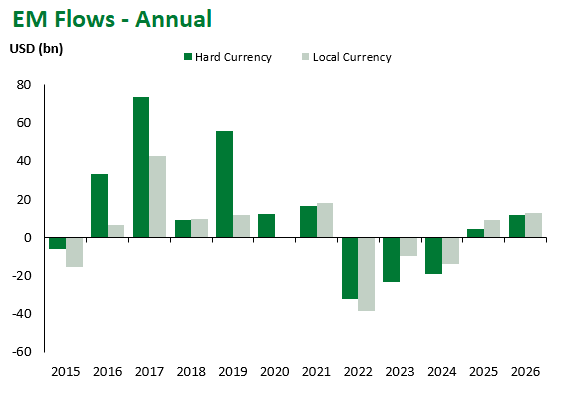
Source for graphs: Bloomberg, JPMorgan, Gramercy. As of August 28, 2026.
For questions, please contact:
Kathryn Exum, CFA ESG, Director, Co-Head of Sovereign Research, [email protected]
Petar Atanasov, Director, Co-Head of Sovereign Research, [email protected]
This document is for informational purposes only. The information presented is not intended to be relied upon as a forecast, research or investment advice, and is not a recommendation, offer or solicitation to buy or sell any securities or to adopt any investment strategy. Gramercy may have current investment positions in the securities or sovereigns mentioned above. The information and opinions contained in this paper are as of the date of initial publication, derived from proprietary and nonproprietary sources deemed by Gramercy to be reliable, are not necessarily all-inclusive and are not guaranteed as to accuracy. This paper may contain “forward-looking” information that is not purely historical in nature. Such information may include, among other things, projections and forecasts. There is no guarantee that any forecasts made will come to pass. Reliance upon information in this paper is at the sole discretion of the reader. You should not rely on this presentation as the basis upon which to make an investment decision. Investment involves risk. There can be no assurance that investment objectives will be achieved. Investors must be prepared to bear the risk of a total loss of their investment. These risks are often heightened for investments in emerging/developing markets or smaller capital markets. International investing involves risks, including risks related to foreign currency, limited liquidity, less government regulation, and the possibility of substantial volatility due to adverse political, economic or other developments. References to any indices are for informational and general comparative purposes only. The performance data of various indices mentioned in this update are updated and released on a periodic basis before finalization. The performance data of various indices presented herein was current as of the date of the presentation. Please refer to data returns of the separate indices if you desire additional or updated information. Indices are unmanaged, and their performance results do not reflect the impact of fees, expenses, or taxes that may be incurred through an investment with Gramercy. Returns for indices assume dividend reinvestment. An investment cannot be made directly in an index. Accordingly, comparing results shown to those of such indices may be of limited use. The information provided herein is neither tax nor legal advice. Investors should speak to their tax professional for specific information regarding their tax situation.