


Executive Summary
UST long-end rout meets an untested official backstop. The 10Y hit a 20-month high and the 30Y hit a 19-year high on AI-related issuance, deficit funding, and term-premium repricing; the Treasury’s doubled buybacks bought only a one-day rally, keeping duration caution and curve-steepening pressure in place.
This week’s market moves were mostly duration-driven, not credit. The rates-driven selloff hit dollar-denominated debt while local currency rallied: local sovereigns led after lagging the prior week, hard currency sovereigns fell with losses widening steadily out the curve, and shorter-duration corporates were insulated, with every rating bucket near flat.
Higher-for-longer crude sorts EM sovereigns into clear winners and losers. Bolivia tops our index, ahead of Zambia, Mozambique, Lebanon and Rwanda, with a second tier running through Pakistan, Sri Lanka, Ethiopia, Kenya and El Salvador. Net exporters screen as the beneficiaries, led by Azerbaijan on twin surpluses, with LatAm exporters gaining on terms of trade while partly buffered from the conflict by distance.
A hawkish-leaning Fed vs. a patient market, with Jackson Hole as the tiebreaker. July FOMC minutes showed hike sympathy well beyond the three dissenters, yet softer inflation and labor data left September odds around 40% making Warsh’s first keynote as Chair the decisive communication event before the September 15-16 meeting.
Market Overview
Macro Update
The defining move of the week came in the U.S. Treasury market, where a long-end selloff drove the 10-year yield to a 20-month high of 4.75% and the 30-year to a 19-year high of 5.34%, as surging AI-related corporate debt issuance, heavy federal deficit funding, and renewed oil-driven inflation concerns lifted term premium estimates. The Treasury responded by at least doubling its long-maturity buyback operations to $4 billion per operation, which bought only a one-day rally. Yields rebounded on Thursday, but the 10-year was back in the 4.70-4.75% range as the week came to a close. For investors, the episode marks the arrival of an explicit official backstop for the long end, but one whose credibility is untested; the term-premium repricing argues for continued caution on duration and keeps curve-steepening pressure in place.
The July FOMC minutes read hawkish, showing that sympathy for a hike extended well beyond the three dissenters. Participants noted that “policy tightening would likely be necessary if inflation did not decline,” and some judged current financial conditions insufficiently tight. The minutes also revealed that Chair Warsh floated reducing the FOMC calendar from eight meetings a year to six, an institutional signal consistent with his communication overhaul. Markets largely looked through the release: July inflation and labor data having softened, implied September hike odds sit around 40%, leaving next week’s Jackson Hole keynote, Warsh’s first as Chair, as the decisive communication event before the September 15-16 meeting.
The U.S.-Iran standoff escalated on the economic front. The 60-day ceasefire expired on Monday, August 17 without the extension that had been reported the prior week, with President Trump ruling out a renewal and stating that no talks are scheduled. Washington pivoted to what Trump called an “economic D-Day”: Treasury Secretary Bessent promised the “toughest sanctions in history,” with details due Monday, targeting Iran’s banks, shipping registries, cash transfers, and smuggling networks, and threatening consequences for countries that continue trading with Tehran, China chief among them. The UAE suspended financial and economic transactions with Iran after accusing Tehran of missile launches and attacks on two ADNOC tankers, while Hormuz transits fell to a low of three vessels a day against roughly 130 pre-war. For investors, the shift from kinetic to economic escalation extends the supply disruption and introduces secondary-sanctions risk into EM trade and financial channels.
Brent rose more than 5% on the week to the $93-94 area, a one-month high and a second consecutive weekly advance, with Ukrainian strikes on Russian energy infrastructure adding a second supply irritant. The dollar softened, with the DXY at its weakest level since May and the euro reaching a two-month high near 1.17, while gold extended its advance toward record territory around $4,600 per ounce, a three-month high. The combination of a weaker dollar, stronger gold, and elevated long-end yields is consistent with markets charging a rising fiscal-and-inflation risk premium on U.S. assets – a supportive backdrop, at the margin, for EM local currency allocations.
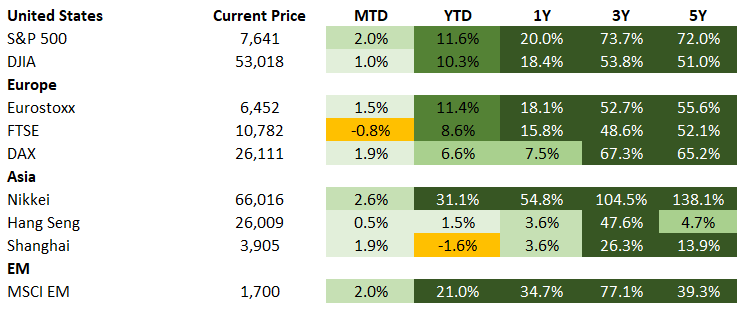
U.S. equities pulled back from record highs, with the S&P 500 ending the week around 2% below its peak and semiconductors down roughly 5% as higher yields pressured long-duration assets. Walmart supplied the week’s answer to the tariff-and-energy passthrough question flagged last week. Shares posted their worst day in more than four years after U.S. comparable sales missed and the company cut its adjusted earnings guidance, evidence that rising costs are reaching the consumer. Alibaba echoed the AI capex trade-off from the Chinese side, with quarterly profit down 75% on accelerated infrastructure spending even as cloud AI revenue grew triple digits for a 12th straight quarter, reinforcing that the capex-versus-monetization divide now spans both sides of the Pacific.
European data leaned firmer. UK July CPI re-accelerated to 2.9% YoY from 2.6%, the first increase since March, driven by the 13% Ofgem energy price cap reset. Core held at 2.6% and services inflation eased to 3.4%, keeping the BoE’s easing cycle interrupted rather than derailed. In the eurozone, the August flash composite PMI rose to 52.1, a nine-month high, with manufacturing at its strongest in four-and-a-half years, hiring resuming for the first time this year, and price pressures easing – a mix that sustains the ECB’s hawkish bias into the September 10 meeting without forcing its hand.
In Asia, Japan’s preliminary 2Q GDP rose 0.3% QoQ, below the 0.5% consensus on flat private consumption, but August flash PMIs were strong and July core CPI edged up to 1.8%, keeping autumn BoJ tightening risk alive with the yen still near 159 vs. USD following last month’s intervention. China held its loan prime rates for a 15th consecutive month even as July data showed weakening industrial output and retail sales and a record contraction in new yuan loans, consistent with our view that Beijing leans on accelerated fiscal implementation rather than fresh monetary easing, a constraint on Chinese asset reflation.
Indonesia delivered the week’s key EM signal. Bank Indonesia held its policy rate at 5.75% in the first decision under Acting Governor Destry Damayanti following Governor Warjiyo’s abrupt exit, emphasizing rupiah stability, expanding hedging incentives for foreign inflows, and citing $1.8 billion of third-quarter portfolio inflows. The continuity message supported the rupiah and local duration and eased the independence concerns that had been built ahead of the meeting.
The Week Ahead
The center of gravity is Jackson Hole on August 27-29, where Chair Warsh delivers his first keynote as Fed Chair on Friday morning, just 19 days ahead of the September 15-16 FOMC. With hike-or-hold pricing roughly balanced, the question is whether he offers a near-term policy steer or keeps to the structural and framework-reform themes of his opening months. July PCE arrives Wednesday, the Fed’s final preferred-gauge reading before September, followed by Nvidia’s results that same evening, the AI complex’s biggest single test after a week of semiconductor weakness. Both land roughly 36 hours before the speech, compressing the week’s catalysts into its back half. Monday’s unveiling of the Iran sanctions package is the geopolitical event. The design of any secondary measures will determine how much pressure spills onto China and other EM trading partners, with Hormuz and Bab el-Mandeb throughput, tanker insurance costs, and the crude and refined product complex the key barometers. The bond market remains its own watch-point. Whether the Treasury’s enlarged buybacks can stabilize the long end through the coming week’s supply will shape duration appetite globally.
For investors, the week should clarify whether the twin pillars of the 2026 risk rally, AI earnings delivery and a patient Fed, remain intact into September, and whether the economic-warfare turn in the U.S.-Iran conflict re-widens the geopolitical premium that energy markets have only partially rebuilt.
Highlights
EM Sovereigns: Vulnerability to oil prices
In a global backdrop characterized by “higher for longer” crude oil prices relative to the pre-Iran war status quo, we look across a multitude of fundamental metrics to help us assess the vulnerability/resilience of market-relevant EM sovereign credits. A few important observations stand out, pointing to relative winners and losers in the current environment and informing our portfolio construction.
The most acute vulnerability sits where oil-import dependence meets thin and/or declining buffers. Bolivia tops our vulnerability index: a net oil-importer economy with a broken currency peg, less than a month of FX import cover, and accelerating inflation. It is followed by a cluster of thin-buffer importers such as Zambia (which however had a recent credit-positive election outcome supporting its outlook), Mozambique, Lebanon, and Rwanda, among others. These are names where a sustained $90-100 Brent environment most directly threatens external accounts and, potentially, debt service capacity. A second tier of vulnerability runs through large importers such as Pakistan, Sri Lanka, Ethiopia, Kenya, and El Salvador, driven less by any single weakness than by the combination of wide fiscal deficits, import dependence, and modest reserve cover. This group also includes some of the countries with the highest GCC remittance/capital linkages.
Unsurprisingly, the main relative beneficiaries tend to be net oil-exporting economies; Azerbaijan is a standout winner in this analysis, boosted by twin (fiscal and external) surpluses and minimal inflation, followed by the likes of Oman, Saudi Arabia, Nigeria, Iraq, Angola, Kazakhstan, Ghana, and Trinidad and Tobago, supported by similarly strong fundamentals. From this group, Saudi Arabia and Iraq are subject to additional geopolitical risks given regional exposure to military re-escalation. Conversely, Latin American exporters such as Brazil, Colombia, Ecuador, and Venezuela benefit from improved terms of trade dynamics, while remaining partially buffered from the conflict due to geographic distance and relatively fewer direct economic linkages compared to their non-LatAm peers.
Hichilema secures second term, sustaining policy continuity amid external headwinds
Event: President Hakainde Hichilema was re-elected on August 13 with roughly 61.4% of the vote against Brian Mundubile’s ~38%. The Electoral Commission of Zambia formally confirmed the result on August 18, avoiding a runoff. The decisive outcome supports policy continuity around the reform agenda that underpinned Zambia’s 2024 debt restructuring and the IMF ECF, which concluded in January 2026. Zambian assets remained broadly steady, reflecting the largely anticipated result.
Investment Implications: The result is credit-positive, reducing political uncertainty and clearing the way for a successor IMF arrangement, with negotiations expected to resume with the new administration in the coming months. Elevated copper prices have supported the external backdrop through 2026, though the trade windfall has been partly offset by higher energy and transportation costs. The vote nonetheless underscores continued sensitivity to cost-of-living pressures, which could limit political room for further austerity and narrow the conditionality perimeter of any successor Fund engagement. External headwinds add to the risks. Prolonged elevated fuel and freight prices combined with a strong El Niño that could disrupt hydropower and agriculture, feeding through to copper production and export receipts, could begin to weigh more materially on the balance of payments position and kwacha. With hard-currency sovereigns having rallied substantially since the 2024 restructuring, current spreads offer less cushion against setbacks to the IMF process, external shocks, or slower reform delivery. Key catalysts are the timing and structure of the successor IMF arrangement, cabinet composition and its signal on the government’s response to cost-of-living pressures, copper-sector policy, and the November-December weather pattern as an early indicator of El Niño risk.
Market Data
EM Credit Update
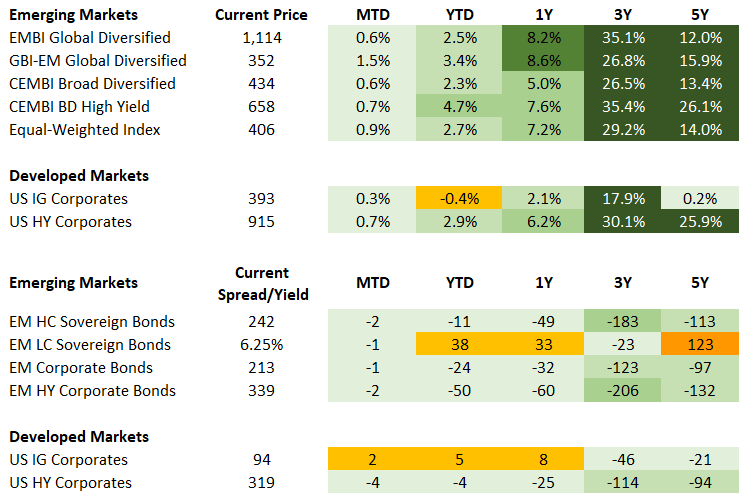
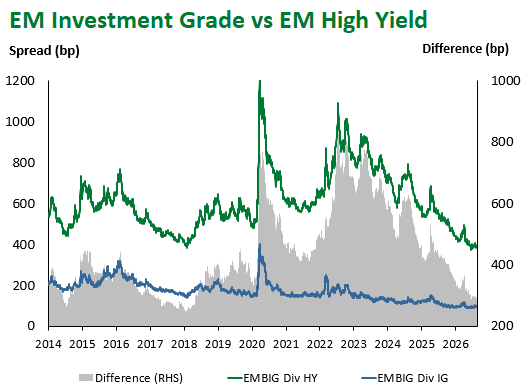
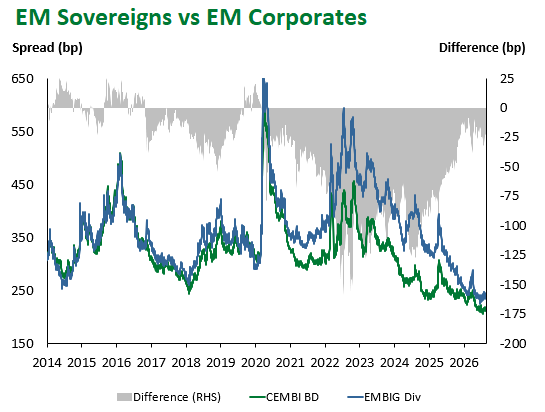
Emerging markets fixed income saw the prior week’s leadership invert, as a rates-driven selloff hit dollar-denominated debt while local currency markets rallied. Local currency sovereigns were the clear outperformer at +0.39% (GBI-EM Global Diversified Index), having been the laggard a week earlier, while hard currency sovereigns fell -0.35% and corporates were close to flat at -0.04%. The driver in the dollar space was duration rather than credit: losses in the EMBIGD widened steadily out the curve, from -0.08% in 1-3 year paper to -0.51% at 10+ years, and every region finished in the red. Investment grade (-0.25%) again held up better than high yield (-0.45%) in sovereigns, extending the prior week’s pattern, with the damage concentrated in the lowest-rated cohorts (CCC -0.86%, B -0.64%) while BB (-0.19%) and unrated (-0.20%) proved most resilient. Corporates were far better insulated, their shorter index duration leaving every rating bucket within a few basis points of flat.
Local currency sovereign debt was the strongest of the three sub-asset classes at +0.39% (GBI-EM Global Diversified Index), reversing the prior week’s mild loss, though currency and rates pulled in different directions across regions. Turkey (+0.94%) led on carry (+0.56%) and price (+0.55%) that together more than absorbed a -0.73% currency drag, followed by Malaysia (+0.82%, FX +0.73%), Indonesia (+0.53%, price +0.50% against FX -0.40%) and Mexico (+0.49%, FX +0.38%). Brazil (-1.40%) was the single weakest index constituent for a second straight week, again currency-led (FX -1.13%), while South Africa (-1.00%) extended its own losing run through rates (price -0.81%). The Philippines (-0.84%) and Chile (-0.82%) were dragged almost entirely by FX, at -1.23% and -0.81% respectively.
Hard currency sovereign bonds fell -0.35%, with investment grade (-0.25%) outperforming high yield (-0.45%) for a second consecutive week. The move was overwhelmingly a duration event. Every region finished lower, with Asia (-0.21%) most resilient and Europe (-0.42%) the weakest. By rating, the deepest losses sat in the lowest-quality cohorts, CCC (-0.86%) and B (-0.64%). Country dispersion stayed wide and, as in the prior week, idiosyncratic distress rather than beta did the damage: Argentina (-2.63%) and Ukraine (-2.20%) were the largest decliners by a clear margin, with Senegal (-1.70%) extending the prior week’s sharp selloff and Egypt (-0.88%), Romania (-0.58%) and Costa Rica (-0.56%) also lagging. The frontier tail again cut both ways, however, as Zambia (+0.77%), Mozambique (+0.69%), Cameroon (+0.63%), Papua New Guinea (+0.35%) and Ghana (+0.34%) posted the week’s largest gains.
EM corporates were essentially unchanged at -0.04%, with investment grade and high yield both returning -0.04%, a marked contrast to the sovereign space, where the quality split was wide. The asset class’s shorter duration profile explains much of the resilience. Regionally, Europe (+0.04%) and Asia (+0.02%) eked out gains, and Latin America (-0.17%) was the clear laggard, mirroring the region’s underperformance in sovereigns. At the country level, Ghana (+0.60%), Trinidad & Tobago (+0.38%), Jamaica (+0.29%) and the Philippines (+0.26%) led, while Ukraine (-0.52%) was the weakest market for a second consecutive week, followed by Colombia (-0.36%), Argentina (-0.33%) and Costa Rica (-0.28%).
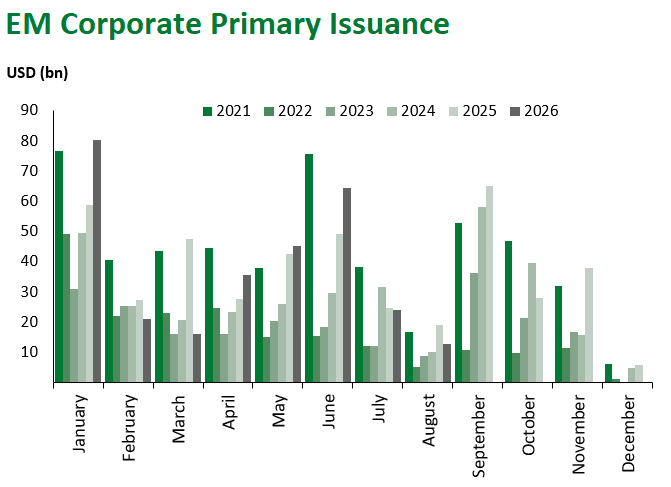
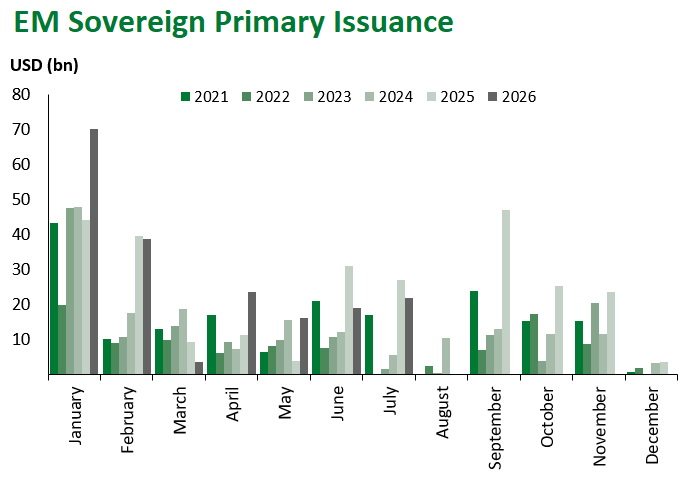
Primary market activity rebounded sharply from the prior week’s near-standstill, with seven issuers pricing approximately $4.3 billion of dollar supply across eight tranches, though the composition was unusually narrow. Every dollar borrower was Asian and all but one were financial institutions, with India accounting for $3.2 billion, Korea $0.7 billion and China $0.5 billion. Supply was almost entirely investment grade ($4.2 billion), and for a third consecutive week there was no hard currency sovereign issuance.
Fixed Income
Equities
Commodities

Source for data tables: Bloomberg, JPMorgan, Gramercy. EM Fixed Income is represented by the following JPMorgan Indicies: EMBI Global, GBI-EM Global Diversified, CEMBI Broad Diversified and CEMBI Broad High Yield. DM Fixed Income is represented by the JPMorgan JULI Total Return Index and Domestic High Yield Index. Fixed Income, Equity and Commodity data is as of August 21, 2026 (mid-day).
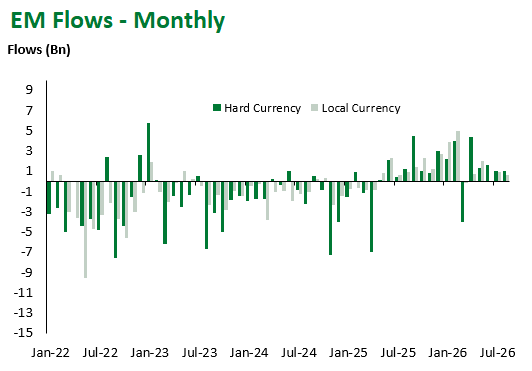
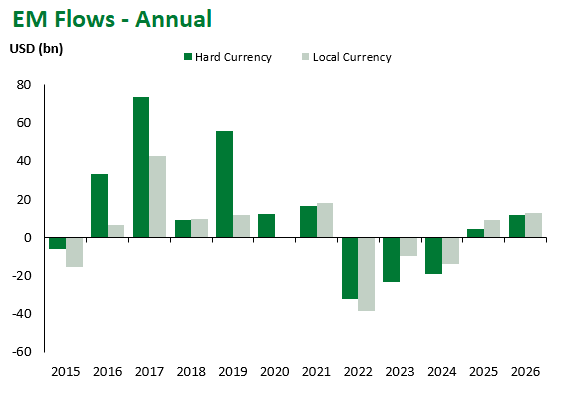
Emerging Markets Flows
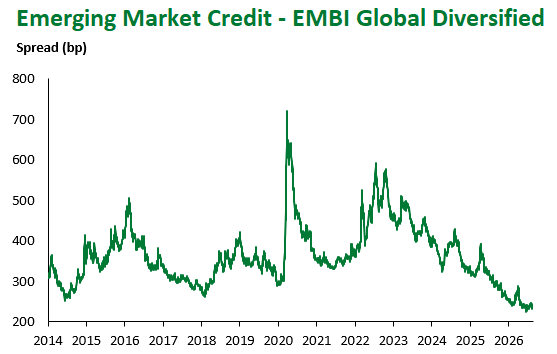
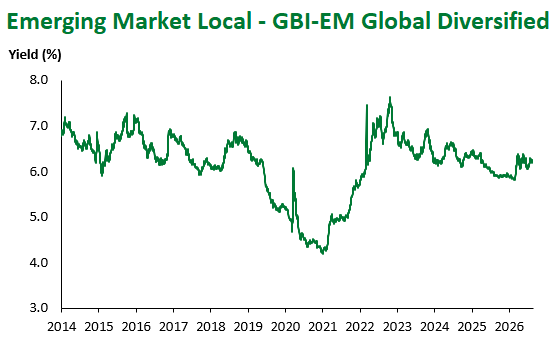
Source for graphs: Bloomberg, JPMorgan, Gramercy. As of August 21, 2026.
For questions, please contact:
Kathryn Exum, CFA ESG, Director, Co-Head of Sovereign Research, [email protected]
Petar Atanasov, Director, Co-Head of Sovereign Research, [email protected]
This document is for informational purposes only. The information presented is not intended to be relied upon as a forecast, research or investment advice, and is not a recommendation, offer or solicitation to buy or sell any securities or to adopt any investment strategy. Gramercy may have current investment positions in the securities or sovereigns mentioned above. The information and opinions contained in this paper are as of the date of initial publication, derived from proprietary and nonproprietary sources deemed by Gramercy to be reliable, are not necessarily all-inclusive and are not guaranteed as to accuracy. This paper may contain “forward-looking” information that is not purely historical in nature. Such information may include, among other things, projections and forecasts. There is no guarantee that any forecasts made will come to pass. Reliance upon information in this paper is at the sole discretion of the reader. You should not rely on this presentation as the basis upon which to make an investment decision. Investment involves risk. There can be no assurance that investment objectives will be achieved. Investors must be prepared to bear the risk of a total loss of their investment. These risks are often heightened for investments in emerging/developing markets or smaller capital markets. International investing involves risks, including risks related to foreign currency, limited liquidity, less government regulation, and the possibility of substantial volatility due to adverse political, economic or other developments. References to any indices are for informational and general comparative purposes only. The performance data of various indices mentioned in this update are updated and released on a periodic basis before finalization. The performance data of various indices presented herein was current as of the date of the presentation. Please refer to data returns of the separate indices if you desire additional or updated information. Indices are unmanaged, and their performance results do not reflect the impact of fees, expenses, or taxes that may be incurred through an investment with Gramercy. Returns for indices assume dividend reinvestment. An investment cannot be made directly in an index. Accordingly, comparing results shown to those of such indices may be of limited use. The information provided herein is neither tax nor legal advice. Investors should speak to their tax professional for specific information regarding their tax situation.