

Contents
Market Overview
Macro Update
The Middle East conflict widened this week rather than stabilizing, opening a second maritime front. Iran’s Houthi allies declared a blockade of Saudi ports and struck two Saudi oil tankers in the Red Sea, extending the war’s reach from the Strait of Hormuz to the Bab el-Mandeb chokepoint. President Trump promised “major military punishment” for Iran and the Houthis and said he was weighing a “massive attack” against Tehran.
Diplomacy, meanwhile, hit a wall. Iran rejected a U.S. ceasefire proposal delivered by Iraqi Prime Minister al-Zaidi, with officials in Tehran saying they were not interested in a temporary deal that leaves control over the Strait of Hormuz unresolved, and signaling that further U.S. escalation would be met with a regional expansion of the fight, including a request that the Houthis close Bab el-Mandeb outright.
On the ground, there was little evidence of relief in the physical oil market. Vessel traffic through the Strait of Hormuz fell almost 50% week-over-week through July 19, averaging roughly 13 crossings a day, with mainstream international shipowners still reluctant to return and only about a third of transiting vessels assessed as compliant with maritime restrictions. Supply risks were compounded outside the Gulf as Kazakhstan suspended crude exports through the Caspian Pipeline Consortium terminal following drone attacks, removing another sizeable stream from an already stretched market.
Against this backdrop, Brent crude, the global benchmark, broke above $100 per barrel for the first time since late May, up roughly $15 on the week and more than 30% above its pre-flare-up levels from earlier this month, before easing back toward the high-$90s on Friday. Refined products remained under acute pressure, with diesel still bearing the combined weight of lost Middle East refining capacity and drone-related disruption to Russian output.
The renewed oil shock flowed directly into rates and FX. U.S. Treasury yields pushed to fresh highs for the year, with the 10Y benchmark around 4.68% and the short-end/belly of the UST curve 13-16bps wider on the week, as markets moved to price the inflationary impulse from $100 oil ahead of the July 28-29 FOMC, with both the Fed and the ECB now expected to hike two times before year-end.
The dollar firmed broadly (DXY > 101) as a haven bid combined with rising U.S. yields, reaching a fresh 40-year high against the yen close to a 164 handle and drawing renewed intervention rhetoric from Japan’s finance ministry, while Japan’s 2Y government bond yield rose to a 31-year high on bets of faster BoJ tightening. Gold held broadly steady near $4,000 per ounce, capped by the firmer dollar and fading rate-cut hopes.
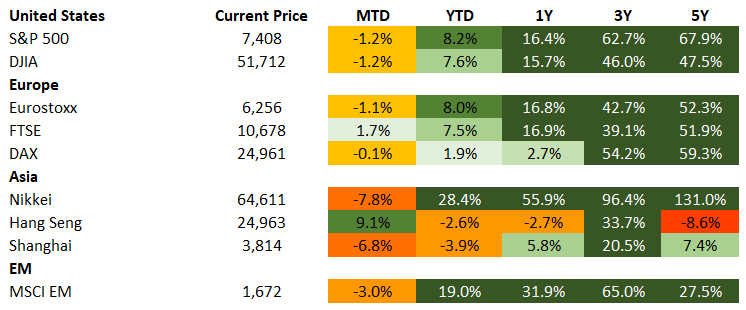
Equities buckled under the twin weight of the oil shock and a deepening AI de-rating. The Dow tumbled around 600 points on Thursday as Brent topped $100, with the Nasdaq leading the retreat as the 2Q reports from Alphabet and Tesla (the first of the mega-cap technology names) sharpened investor scrutiny of AI-driven capital spending. Both companies beat on the top line (Alphabet’s revenue rose 24% with Google Cloud up 81%; Tesla’s revenue grew 26%), yet both reported negative free cash flow as capex ballooned (Alphabet guided spending to as much as $205 billion this year) and both stocks fell after the results, an ominous signal for the remainder of the mega-cap earnings slate.
Meanwhile, trade policy re-entered the picture. On Thursday, the U.S. Trade Representative announced new Section 301 tariffs of 10-12.5% on 60 trading partners covering roughly 99% of U.S. imports, effective just after midnight Friday, replacing the temporary 10% global tariffs that expired the same day after the Supreme Court struck down the prior IEEPA-based regime. The move capped one of the busiest weeks of the administration’s trade agenda, which also featured 25% tariffs on Brazilian goods (with an expanded exclusion list) and 50% levies on various Canadian products, prompting Prime Minister Carney to accuse Washington of violating the USMCA – an inauspicious backdrop for the agreement’s upcoming review.
The ECB unanimously held its deposit rate at 2.25% in a hawkish-leaning pause, with President Lagarde noting the full inflationary impact of the energy shock has yet to play out and markets pricing a September hike. In emerging markets, a heavy central bank calendar was dominated by war-driven caution. The PBoC held its loan prime rates unchanged for a 14th straight month, and Nigeria kept its policy rate at 26.50%, explicitly citing renewed U.S.-Iran hostilities. Bank Indonesia delivered the week’s first surprise, pausing at 5.75% after 100bps of hikes since May and pivoting to foreign-inflow incentives to defend a rupiah still near record lows.
Türkiye held at 37% for a fourth consecutive meeting, flagging a renewed energy-driven rise in the underlying inflation trend, while South Africa’s SARB delivered the week’s second surprise, holding at 7% in a split 4-2 vote despite June inflation at a two-year high of 5.0%, sending the rand down around 2% on the day. Hungary, a disinflation outlier on forint strength under the new pro-EU government, cut another 25bps to 5.75% and signaled a further cut in August. Kazakhstan’s central bank also surprised with a 25bps cut to 16.75% and signaled more cuts are possible, highlighting the diverging outlooks EM economies and policymakers are currently facing.
EM Credit Update
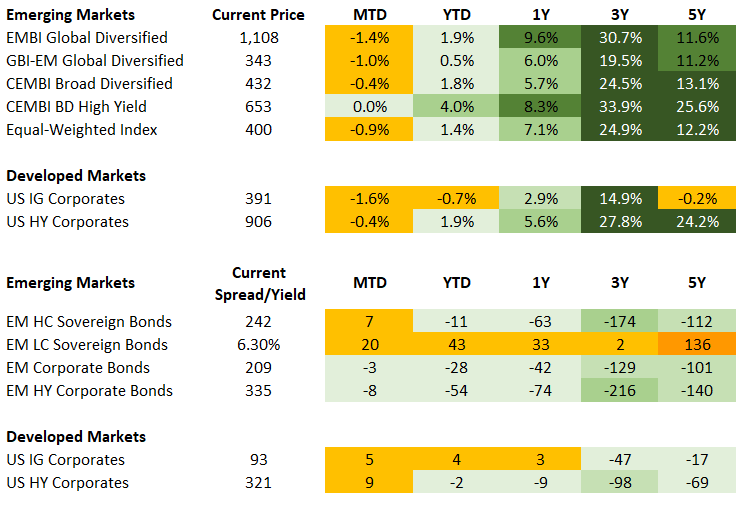
Emerging Markets (EM) fixed income was broadly lower this week, with all three sub-asset classes negative and losses concentrated in longer-duration, higher-quality paper. Renewed U.S.-Iran escalation fears drove U.S. Treasury yields higher and weighed most on rate-sensitive segments and on the sovereigns most exposed to the conflict. EM corporates were the most resilient, down -0.38%, while local currency sovereigns fell -0.75% and hard currency sovereigns lagged the complex at -0.86%. Investment grade underperformed high yield in both sovereigns and corporates, and returns deteriorated steadily with duration, pointing to a rates-led move rather than a broad credit repricing.
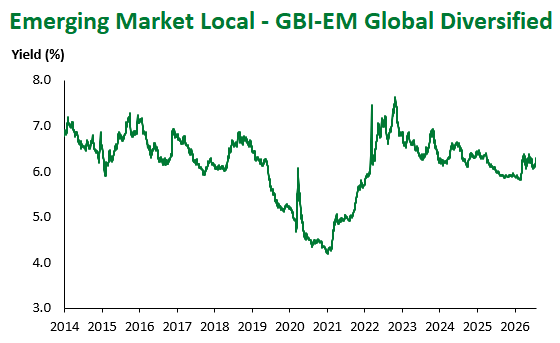
Local currency sovereign debt declined -0.75%, pressured by a firmer U.S. dollar as escalation fears revived safe-haven demand and by higher local rates. South Africa was a sharp outlier to the downside (-4.38%), with the rand and local rates both contributing, followed by Chile (-2.81%), Colombia (-2.28%), and Hungary (-2.04%). Central European markets broadly lagged, with Poland (-1.89%) and the Czech Republic (-1.62%) also among the weakest. Only a handful of markets finished higher: the Dominican Republic (+0.80%), Uruguay (+0.20%), China (+0.15%), and Indonesia (+0.09%).
Hard currency sovereign bonds fell -0.86%, the weakest of the three sub-asset classes. Investment grade (-0.93%) underperformed high yield (-0.79%), and the selloff steepened with duration, from -0.26% in the 1-3 year bucket to -1.38% for 10+ year maturities, consistent with a Treasury-led move. Regionally, an energy-exporter bias showed through: Africa (-0.64%) and the Middle East (-0.68%) proved most resilient, while net oil-importing Asia (-0.92%) lagged alongside Latin America (-0.96%) and Europe (-0.91%). Gains at the country level were confined to frontier, distressed, and oil-exporting names, led by Mozambique (+1.21%), Lebanon (+1.01%), and Senegal (+0.54%), with oil exporters Iraq (+0.22%) and Angola (+0.19%) also positive. Egypt (-1.34%), a net energy importer with direct regional exposure, was among the weakest, alongside Argentina (-1.42%) and Ukraine (-2.07%), the latter the single worst performer.
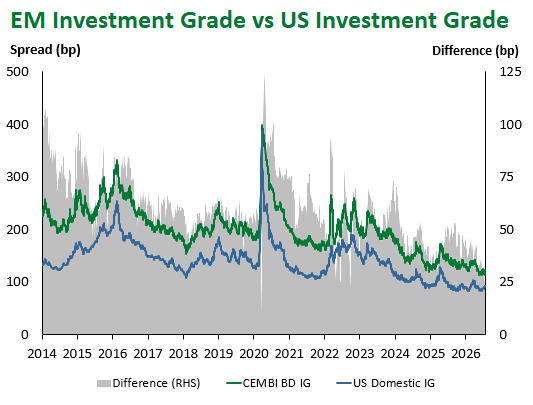
EM corporates were the relative outperformers, with the index down -0.38%, cushioned by shorter duration and higher carry. High yield (-0.17%) meaningfully outperformed investment grade (-0.52%). By rating, the B (-0.05%) and BB (-0.26%) buckets held up best while single-A (-0.50%) and BBB (-0.55%) lagged, reflecting the sensitivity of higher-quality paper to the rates move. The duration gradient mirrored sovereigns, with 1-3 year bonds down -0.11% versus -0.78% for the 10+ year segment. Regional performance was tightly clustered, from Europe (-0.31%) and Africa (-0.30%) at the stronger end to the Middle East (-0.42%) at the weaker end. Ghana (+0.88%) was the notable upside standout.
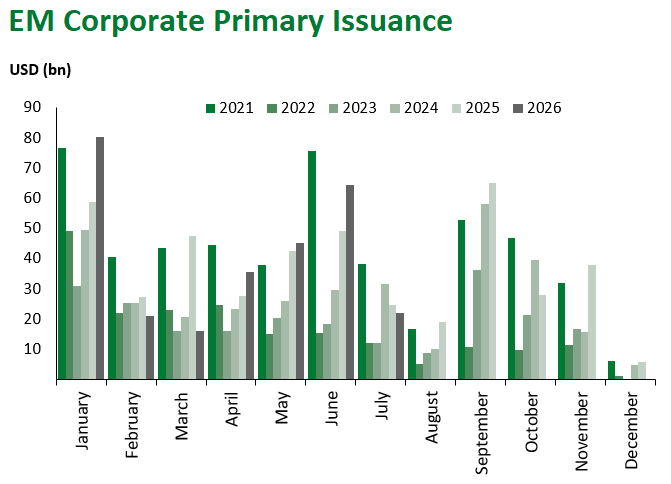
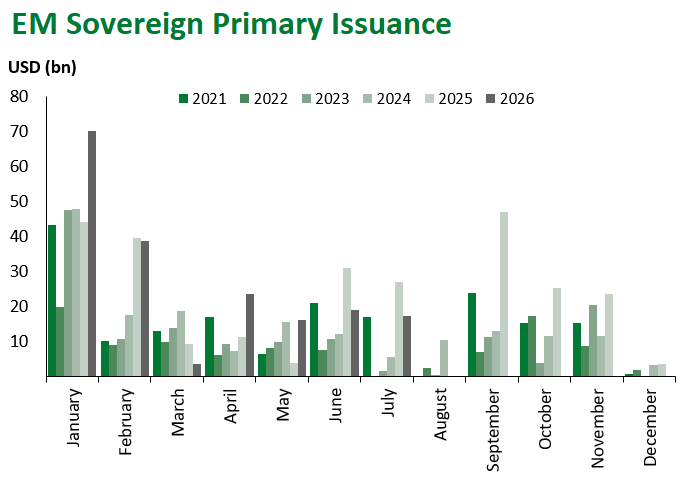
Primary market activity, hard currency only, was healthy despite the weaker tone, with 13 issuers raising approximately $13.1 billion, predominantly from investment grade and sovereign borrowers. Kuwait dominated supply with a $6 billion triple-tranche sovereign deal across 3, 5, and 10 year maturities that drew combined books of roughly $14 billion. Malaysia followed with a $1.5 billion dual-tranche sukuk, and Honduras priced an $816 million long-dated high yield sovereign. High yield corporate supply included Constellation Oil Services of Brazil ($625 million, amortizing, ~5.3-year weighted average life), Continuum Energy of Singapore ($390 million), and Petroquimiva Comodoro of Argentina ($400 million), alongside investment grade issuance from ICICI Bank, CMB Financial Leasing, Fubon Life (a Tier 2), and Korean corporates Hanwha Aerospace and Korea Midland Power.
The Week Ahead
The overriding event is the July 28-29 FOMC, the Fed’s second meeting, with the market debating whether last month’s disinflation reprieve can survive $100 oil and a fresh round of tariffs, with futures now close to two hikes before year-end. The Bank of Japan also meets, with the yen at 40-year lows keeping intervention risk elevated. U.S. releases include the advance 2Q GDP print and June PCE, while the mega-cap earnings season broadens to Microsoft, Meta, Apple, and Amazon, where AI capital spending will remain under the microscope after this week’s reception of Alphabet and Tesla. In Europe, 2Q GDP and July flash inflation will frame the ECB’s September decision. The new U.S. tariffs on 60 trading partners take effect, with attention on retaliation and on the unresolved USMCA friction with Canada. Geopolitically, the key barometers now span two chokepoints – Strait of Hormuz throughput and the risk of a Bab el-Mandeb closure – alongside the fate of ceasefire diplomacy after Tehran’s rejection of the latest U.S. proposal, and the crude and diesel complex.
Fixed Income
Equities
Commodities

Source for data tables: Bloomberg, JPMorgan, Gramercy. EM Fixed Income is represented by the following JPMorgan Indicies: EMBI Global, GBI-EM Global Diversified, CEMBI Broad Diversified and CEMBI Broad High Yield. DM Fixed Income is represented by the JPMorgan JULI Total Return Index and Domestic High Yield Index. Fixed Income, Equity and Commodity data is as of July 24, 2026 (mid-day).
Highlights
Argentina and Pakistan score additional ratings upgrades
Event: Moody’s upgraded Argentina to B3 from Caa1 with a positive outlook on July 21, aligning all three major agencies at B- equivalent level for the first time since 2019. Separately, S&P upgraded Pakistan to B from B- with a stable outlook on July 22, Pakistan’s first B rating since 2019. The upgrades reflect fiscal discipline, external reserve rebuilding, and gradual reform momentum. Both countries’ credit spreads now trade near multi-year tights.
Gramercy Commentary: The upgrades reinforce a broader theme of lower-rated EM sovereigns showing greater resilience this cycle than in prior external shocks, reflecting disciplined policy execution and expanded bilateral and multilateral support. The Argentina alignment across all three agencies is particularly consequential, unlocking institutional mandates that require multiple agency ratings above the distressed category. Continued rating momentum and spread compression will hinge on policy execution against known pressure points, notably Argentina’s reserve build into 2027 maturities and the approaching political cycle, and Pakistan’s structurally high interest burden and rolling external financing needs as well as its managed exchange rate.
Emerging Markets Technicals
Emerging Markets Flows
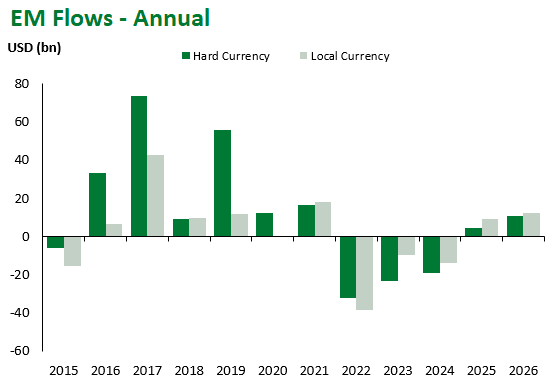
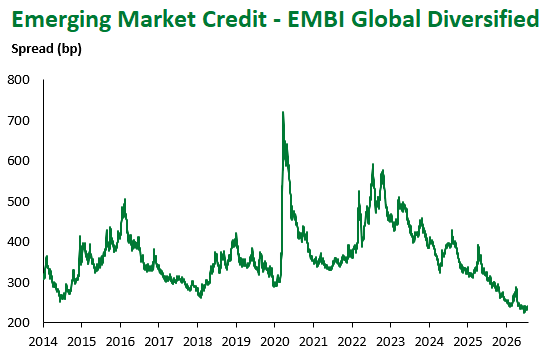
Source for graphs: Bloomberg, JPMorgan, Gramercy. As of July 24, 2026.
For questions, please contact:
Kathryn Exum, CFA ESG, Director, Co-Head of Sovereign Research, [email protected]
Petar Atanasov, Director, Co-Head of Sovereign Research, [email protected]
This document is for informational purposes only. The information presented is not intended to be relied upon as a forecast, research or investment advice, and is not a recommendation, offer or solicitation to buy or sell any securities or to adopt any investment strategy. Gramercy may have current investment positions in the securities or sovereigns mentioned above. The information and opinions contained in this paper are as of the date of initial publication, derived from proprietary and nonproprietary sources deemed by Gramercy to be reliable, are not necessarily all-inclusive and are not guaranteed as to accuracy. This paper may contain “forward-looking” information that is not purely historical in nature. Such information may include, among other things, projections and forecasts. There is no guarantee that any forecasts made will come to pass. Reliance upon information in this paper is at the sole discretion of the reader. You should not rely on this presentation as the basis upon which to make an investment decision. Investment involves risk. There can be no assurance that investment objectives will be achieved. Investors must be prepared to bear the risk of a total loss of their investment. These risks are often heightened for investments in emerging/developing markets or smaller capital markets. International investing involves risks, including risks related to foreign currency, limited liquidity, less government regulation, and the possibility of substantial volatility due to adverse political, economic or other developments. References to any indices are for informational and general comparative purposes only. The performance data of various indices mentioned in this update are updated and released on a periodic basis before finalization. The performance data of various indices presented herein was current as of the date of the presentation. Please refer to data returns of the separate indices if you desire additional or updated information. Indices are unmanaged, and their performance results do not reflect the impact of fees, expenses, or taxes that may be incurred through an investment with Gramercy. Returns for indices assume dividend reinvestment. An investment cannot be made directly in an index. Accordingly, comparing results shown to those of such indices may be of limited use. The information provided herein is neither tax nor legal advice. Investors should speak to their tax professional for specific information regarding their tax situation.