
Authored by:
- Philip Meier, Managing Director, Head of Emerging Markets Debt
- Belinda Hill, CFA, Managing Director, Emerging Markets Debt Portfolio Manager
- Tolu Alamutu, CFA, Senior Vice President, Research Analyst
- James Barry, Vice President, Research Analyst
November 19, 2020 A pdf file of the complete paper can be downloaded here.
In a world of structurally lower rates for longer, Emerging Markets Debt in hard-currency, especially in U.S. Dollar, is attractive on a relative basis. It remains one of the last scalable sources of yield for institutional investors that require robust investment returns to bridge the gap between their assets and liabilities without significant incremental risk. Indeed, Emerging Markets Debt’s consistently-better Sharpe Ratio compared to developed markets fixed income asset classes (namely, U.S. Investment Grade and High Yield), has, in Gramercy’s opinion, earned it a place as a core strategic allocation for institutional investors. Yet, this is not an asset class that is suitable for index funds. The need for active management is even more important in the difficult macroeconomic backdrop in which we find ourselves today, with a global pandemic going into a potential second wave that may have long-lasting consequences on global GDP, globalization and debt payment behavior.
Despite the Emerging Markets Debt universe in hard-currency being a primarily investment grade asset class, there will be significant headwinds to navigate. From a top-down perspective, next to the increasing importance of central bank policies and government stimulus, geopolitical risks as well as commodity markets, it is even more crucial to develop a deep understanding of valuations and technical drivers. A strong top-down framework will prove to be a key success factor in a world of detached valuations that are driven by technical factors more than macroeconomic and corporate fundamentals. However, while necessary, it will not be sufficient. Bottom-up factors will be as important, if not more, in certain circumstances. This is particularly true for granular analyses of creditworthiness, liquidity and other micro valuation metrics. Credit selection will be more critical than ever to avoiding unrecoverable mistakes and better managing downgrade risks. A deep pool of emerging markets investment professionals with experience through the credit cycle will be critical to successfully managing the increasingly difficult environment into 2021.
Investors seem to agree with our conclusions. Year-to-date, according to EFPR, inflows into Emerging Markets Debt in hard-currency total $4.7bn and a stunning $24.4bn since April of 2020. In light of new lockdowns announced on a weekly basis, even a potential double-dip recession in much of the advanced world might not derail the investment case of Emerging Markets Debt in hard-currency so long as central banker’s response is timely. In fact, with highly effective vaccines being the light at the end of the tunnel, it might be a buying opportunity but one needs to know what to buy and manage it actively.
EMERGING MARKETS DEBT: ATTRACTIVE ON A RELATIVE BASIS
Emerging Markets Debt in hard-currency continues to offer compelling yields relative to comparable developed markets bonds. As such, the asset class may be used by institutional investors to meet their relatively high investment return assumptions without taking on significantly more risk or compromising on credit quality. Indeed, Emerging Markets Corporate Debt has historically registered a superior Sharpe Ratio compared to developed markets fixed income asset classes, e.g. U.S. IG or U.S. HY.
While some metrics have weakened in the face of the COVID-19 shock, emerging markets remains primarily an investment grade asset class with many resilient issuers that still offer more spread per turn of leverage than their developed markets peers. The latter is true even within same issuer groups where the parent is part of the developed markets debt market and substantial subsidiaries are located in emerging markets. Furthermore, given the growth of the emerging market sovereign and corporate bond universe and the share of world GDP growth that emerging markets represent, we believe that the asset class is scalable and too big to ignore.
INSTITUTIONAL RETURN ASSUMPTIONS REMAIN HIGH
The stock of negative-yielding debt is fast approaching the U.S.$17trn peak reached in August 2019. Also, according to J.P. Morgan, 80% of the developed markets fixed-rate sovereign debt market currently yields less than 0.5%.
Central banks’ actions – primarily rate cuts and asset purchases – have helped propel this move. Set against this, the U.S. National Association of State Retirement Administrators (NASRA) estimated a median nominal investment return assumption for U.S. pension funds of 7.25% in October 2020. This return assumption has moderated from approximately 8% in recent years; however, in the context of persistently low yields in developed markets, it remains quite high, so it is not hard to argue that something will have to give.


Although expected return assumptions could be lowered drastically, this will almost certainly have adverse consequences for funding gaps. As an example, U.S. state pension unfunded liabilities continue to rise, with one estimate putting the figure at over U.S.$1.6trn this year. Cost cutting may help, but this can only go so far without raising operational and other risks. We believe there is another way. A core strategic allocation to emerging market debt can help investors targeting robust returns, without taking on significantly higher risk or compromising on issuer quality.
EMERGING MARKETS DEBT ENHANCES RETURNS WITHOUT SIGNIFICANTLY INCREASING RISK
Higher yields for lower duration
The comparison of emerging markets sovereign bonds and their developed markets peers can be tenuous given differing central bank policies and currencies, amongst other factors. Having said that, as one telling example, we note that Indonesia’s USD 5.875% 2024 bond currently yields almost 40 basis points more than Portugal’s USD 5.125% 2024 security, even though both sovereigns are rated triple-B. It goes without saying that both countries are on opposing trajectories in terms of growth and macroeconomic fundamentals.
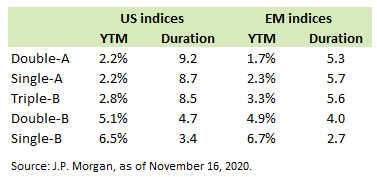 Moving to emerging markets corporate bonds, the comparison is much easier and leads to a powerful outcome: emerging markets corporate issuers tend to yield more than similarly-rated advanced country peers in the same currency, e.g. U.S. Dollar. This applies in four of the five relevant rating categories: single-A, triple-B, double-B and single-B. This is despite the fact that the duration of these bonds is usually shorter on average. The table above shows average yields and average duration data for U.S. and emerging markets corporate bonds. Emerging markets yield up to 140 basis points more than U.S. peers, making these issuers attractive, especially in the current low yield environment.
Higher yields within same issuer groups with global operations
Taking BBVA Group as an example, the emerging markets versus developed markets yield differences are evident even within the same issuer group. Headquartered in Spain, BBVA also maintains operations all over the world, most notably in Mexico where its subsidiary, BBVA Bancomer, is the largest bank. BBVA Group also includes Garanti BBVA, one of the largest lenders in Turkey. In the first half of 2020, Mexico accounted for 52% of the Group’s net attributable profit while Turkey accounted for 21%. In fact, while BBVA Group’s emerging market businesses accounted for just a third of assets in the first half of 2020, they generated 91% of net attributable profit.
Despite this, BBVA Group bonds generally trade tighter than securities issued by BBVA Bancomer. BBVA Bancomer’s 2033 subordinated bond yields more than the BBVA Group subordinated security which matures in the same year. The BBVA Bancomer bond did yield less than the BBVA Group security in early 2020 but that relationship has since reversed, with the Mexican entity currently offering close to 30 basis points more yield than its parent with both bonds denominated in U.S. Dollar. BBVA Group levels may well reflect a ‘diversity premium’ of sorts; however, it may also be argued that the Mexican subsidiary should benefit from that diversity as well – there could be a ‘support premium.’
Attractive risk-adjusted returns
While it is easy to assume that these higher yields come at a cost in terms of significantly more risk, this is not necessarily so. For example, with a Sharpe Ratio of 1.2 over the last ten years, the risk adjusted return for emerging markets corporate bonds has been the highest among the major credit asset classes (with Sharpe Ratios ranging between 0.8 and 1.0). Even more interestingly, Sharpe Ratios for developed markets credit over the last five years have dropped precipitously while the Sharpe Ratio of emerging markets corporate bonds has declined much less. Since 2015, the average Sharpe Ratio of major developed markets asset classes fell to 0.5 from an average of 1.7 during 2010 to 2014. During the same time period, the Sharpe Ratio of emerging markets corporate bonds only fell to 1.0 from 1.4.
J.P. Morgan attributes the reduced volatility relative to developed markets credit to (i) the maturation of the emerging markets corporate bonds asset class with higher dedicated AuM, (ii) higher participation of local investors, (iii) lower duration, and (iv) higher quality composition.


Source: J.P. Morgan. Note: Based on weekly returns annualized. CEMBI Broad for EM corporates, EMBIG Diversified for EM sovereigns, JULI for US HG, and JPM Domestic HY for US HY. Euro HG and HY are the respective iBoxx corporate indices. As of November 2020.
Emerging Markets Debt is primarily an investment grade asset class
It is important to highlight that Emerging Markets Debt is primarily an investment grade and not a high yield asset class as is often the misconception. Specifically, each of the emerging markets index, including sovereign and corporate indices, has over 50% of its market value in investment grade issuers, whose fundamentals are more resilient.
EMERGING MARKETS DEBT IS A SCALABLE ASSET CLASS
With a relatively limited number of economies classified as ‘advanced’, emerging markets countries have long outnumbered so called developed peers. On a nominal basis, economic output is catching up quickly. IMF estimates show that output from emerging economies, as measured by current (nominal) GDP, account for around 40% of the world’s total in 2019-2020, having doubled from around 20% at the turn of the century. In purchasing-power-parity (PPP) terms, emerging markets have outweighed developed markets as a share of total global GDP since 2008 and currently account for 57-58% of the total world output. By 2025, emerging markets are projected to contribute more than 60% of the world’s GDP in PPP terms, reflecting the long-term trend that growth in these markets outpaces growth in the developed world. Indeed, on current economic and demographic trends, it will not take long after that before emerging markets account for more than half of the world’s GDP even in nominal terms.


The emerging markets growth story does not just apply to output. It applies to the size of the bond market as well. Since 2013, outstanding emerging markets corporate bonds have exceeded one trillion U.S. Dollars, increasing from a modest U.S.$75bn less than 20 years ago.

Sidelining emerging markets could potentially involve missing out on more than 40% of the world’s output or, alternatively, bond markets larger than the U.S. high grade corporate bond market. For investors seeking the most suitable opportunities, emerging markets have become too big to ignore. For institutional investors, this is important because it means a strategic allocation to Emerging Markets Debt is scalable.
DESPITE HEADWINDS, EMERGING MARKETS’ FUNDAMENTALS STILL COMPARE WELL TO U.S. PEERS
Understandably, the rise in emerging markets issuance over the years has led to concerns about corporate leverage. Looking at only one side of the equation is too short sighted though, as additional debt has been accompanied by the superior growth presented earlier. In this context, interestingly, gross leverage is off its peak and is now only marginally higher than that of U.S. peers. However, net leverage in emerging markets continues to be well below that of the U.S. market. As shown below, LTM 2020 net leverage for EM IG Corporates and HY Corporates was 1.9x and 2.6x, respectively, vs 2.5x and 3.8x for U.S. IG and U.S. HY, respectively.


Another concern is greater reliance on short-term debt in emerging markets. This is often the result of emerging markets issuers funding working capital through local bank markets, which typically only provide shorter dated securities to better match their own funding. Near-term liabilities account for around a quarter of total debt, and this ratio has hovered around this level since 2017.
While the interest coverage ratio remains robust and on par with U.S. peers at approximately 7.0x, in order to mitigate the risk of higher short-term liabilities, emerging markets issuers commonly maintain healthy cash balances as buffers. Since 2008, the average ratio of cash to total debt for emerging markets issuers has been 32% vs only 22% for U.S. peers. Nonetheless, understanding the nature of issuers’ relationships with local banks is one of the key qualitative factors that must be diligence appropriately by an experienced emerging markets research team.
We also note that leverage metrics should be considered relative to valuations. For this, we highlight the spread per turn of leverage metrics in the charts below. Emerging market issuers offer almost 2x more in terms of spread than U.S. peers. It is important to point out also that every rating category in emerging markets offer additional compensation per turn of leverage relative to the U.S.


The well-flagged impact of COVID-19 on economic growth has led to a justified increase in the focus on corporate fundamentals, particularly in emerging markets. 2020 has been particularly difficult for some corporates to navigate. Other corporates have flourished. While we believe that the majority of emerging markets corporate issuers have resilient balance sheets and liquidity, we acknowledge that the challenges that lie ahead are immense and that there will be winners and losers in a post COVID-19 world. There may be more defaults – this is something we have previously discussed. This is why we believe that active management, where credit selection based on granular research are key, is more important than ever before.
In this context, however, and especially for those who like comparing EM to HY corporates, it is important to highlight that, according to J.P. Morgan, U.S. HY default rates have been higher than that of EM HY Corporate default rates in 11 of the last 13 years, including the last 7 years. J.P. Morgan expects this to remain the same in 2020 with U.S. HY expected to reach a default rate of 8% by year end, while the default rate for EM corporates is only expected to reach 4.5%. Furthermore, EM HY Corporates recovery rates for the last 13 years have been, on average, higher than that of U.S. HY at 41% vs 38%, respectively. While EM HY Corporates recovery rates have remained relatively stable in 2019 and YTD 2020 at 50% and 43%, respectively, U.S. HY recovery rates have fallen precipitously during the same time period to 23.2% and 17.1%, respectively.
EMERGING MARKET DEBT: CAPITALIZING WITH ACTIVE MANAGEMENT
The growth of Emerging Markets Debt, coupled with a more difficult macroeconomic backdrop, has increased the complexity of investing in this asset class. In this context, we believe that active management is a critical component of a successful strategic allocation to Emerging Markets Debt. Active management is the only way to capture the relative attractiveness appealing to institutional investors and avoiding the pitfalls of a COVID-19 influenced investment landscape at the same time.
OPPORTUNITIES FOR ACTIVE MANAGEMENT
- Capitalizing on information asymmetry. Despite the growth in the asset class, we estimate that the ratio of emerging markets sell-side analysts per credit is 1 to 5 compared to developed markets, giving active managers with access to a deep pool of experienced emerging markets research analysts an edge in finding attractive alpha-generating opportunities.
- Finding off index opportunities. Active managers can look to a broader emerging markets investment universe where there may be many interesting investment opportunities. As an example, while the J.P. Morgan CEMBI Broad Diversified, the benchmark index for emerging markets corporates, has 690 issuers, there are an additional 446 off-index issuers with debt outstanding that can be combed through by an experienced emerging markets team to find alpha generating opportunities.
- Exploiting index evolution. Benchmark indices are constantly evolving. Active managers have the ability to position themselves for changes ahead of forced buying by index-driven investors (e.g. China inclusion). This is most common within emerging market hard-currency bonds but is also occurring within local currency indices.
- Replicating index moves related to post-default credits. Active management is the only way for investors to take positions to replicate the impact of index exclusion of restructured debt and subsequent inclusion of post-restructuring debt. When an issuer defaults, its debt is not automatically removed from the index, which means that index yields and spreads are distorted by defaulted debt, massively in some instances (e.g. J.P. Morgan EMBIG Diversified, the benchmark index for emerging markets sovereigns, with Argentina and Ecuador pre-September 2020). When those issuers finalize their debt restructurings and the defaulted debt, which was distorting the index, is replaced with new post-restructuring bonds at more normalized yields and spreads, the index automatically reprices tighter. In the Argentina and Ecuador example, the index automatically repriced by 17 basis points in September 2020 due to this phenomenon. This technically-driven repricing cannot be captured by investors unless an active manager understands the nuances of the restructurings and the index exclusion/inclusion and seeks to replicate the anticipated moves ahead of time.
- Implementing more nuanced positioning relative to the index. Index weights are usually based on market capitalization, which results in higher weightings for the most heavily indebted issuers. Active managers can choose to go underweight or completely avoid issuers which are fundamentally weak but which comprise a significant part of the index.
- Harnessing upside of fallen angels and rising stars. In the current environment, fallen angels in particular present an opportunity for actively managed portfolios. In some instances, such downgrades are driven by sovereign rating cuts rather than company-specific factors. Passive management may result in forced selling of these

issuers’ securities. The flexibility of actively managed portfolios enables investors to take advantage of dislocations, which can result from such forced selling. The table to the left highlights how select fallen angels in emerging markets have performed this year. The loss of investment grade ratings remains a potential threat for some sovereigns. As one example, Colombia’s low triple-B ratings at S&P and Fitch both carry negative outlooks.
- Integrating ESG Process. Active portfolio management allows ESG to be integrated into the investment process in a more robust manner. ESG in fixed income has long been about exclusions that simply get applied to funds. In our opinion, ESG processes need to evolve from simply considering what to include vs. exclude, to using ESG-related data in bottom-up processes to make better investment decisions. Active managers can increasingly use more dimensions of the data (e.g. a very tight sovereign issuer that has poor ESG metrics might have big downside risks resulting in an active manager choosing to be underweight that credit). Whereas a rather weak credit with good ESG metrics might get a lift from ESG-related fund buying. The situation is similar but slightly more complex in corporates as you need to apply factors sector by sector. Similarly to the sovereign space, however, this should be done by the very same analyst who covers the credit and leads to more holistic recommendation to buy or sell.
- Understanding fragmented markets. Local currency emerging market debt markets can be especially fragmented. As examples, Brazil, Mexico, South Africa and Turkey have large domestic investor bases, but Ukraine, Kazakhstan, Oman and Argentina do not. In addition, several local markets impose withholding taxes of 30-40 basis points, which are hard to avoid for passive managers. Active management can mitigate this by factoring these charges into expected return analysis or implementing off-benchmark proxy trades.
- Managing the credit cycle. Passive investors may not be protected from the volatility inherent in the credit cycle and thus may be exposed to a greater share of unrecoverable mistakes than active managers, especially those, with long dated experience in emerging markets through various cycles. Active management can result in shallower troughs. Experience makes a difference. With the onset of the COVID-19 pandemic, we are seeing a deep global recession in 2020. Estimates are that global GDP will take at least two years to recover to 2019 level. Also, longer-term effects on globalization and other supply side factors could undermine future output. It is likely that a severe second wave may usher in additional calls for a paradigm of non-payment for the weakest emerging markets sovereign issuers and that additional defaults will be seen in the corporate space. With this difficult macroeconomic backdrop and the resulting pressure on fundaments, credit selection is becoming increasingly important to alpha-generation. There will be winners and losers over the next year and a deep bench of emerging markets research analysts and portfolio managers that understand the intricacies of emerging markets credit is the only way to separate the good from the bad.
About Gramercy
Gramercy is a dedicated emerging markets investment manager based in Greenwich, CT with offices in London, Buenos Aires, and Mexico City and dedicated lending platforms in Mexico City and Istanbul. The firm, founded in 1998, seeks to provide investors with superior risk-adjusted returns through a comprehensive approach to emerging markets supported by a transparent and robust institutional platform. Gramercy offers alternative and long-only strategies across emerging markets asset classes including multi-asset, capital solutions, private credit, distressed debt, USD and local currency, sovereign, high yield/corporate debt, and special situations. Gramercy is a Registered Investment Adviser with the SEC and a Signatory of the Principles for Responsible Investment (UNPRI). Gramercy Ltd, an affiliate, is registered with the FCA.
Contact Information:
Gramercy Funds Management LLC
20 Dayton Ave
Greenwich, CT 06830
Phone: +1 203 552 1900
www.gramercy.com
Joe Griffin
Managing Director, Business Development
+1 203 552 1928
[email protected]
Investor Relations
[email protected]
This document is for informational purposes only, is not intended for public use or distribution and is for the sole use of the recipient. It is not intended as an offer or solicitation for the purchase or sale of any financial instruments or any investment interest in any fund or as an official confirmation of any transaction. The information contained herein, including all market prices, data and other information, are not warranted as to completeness or accuracy and are subject to change without notice at the sole and absolute discretion of Gramercy. This material is not intended to provide and should not be relied upon for accounting, tax, legal advice or investment recommendations. Certain statements made in this presentation are forward-looking and are subject to risks and uncertainties. The forward-looking statements made are based on our beliefs, assumptions and expectations of future performance, taking into account information currently available to us. Actual results could differ materially from the forward-looking statements made in this presentation. When we use the words “believe,” “expect,” “anticipate,” “plan,” “will,” “intend” or other similar expressions, we are identifying forward-looking statements. These statements are based on information available to Gramercy as of the date hereof; and Gramercy’s actual results or actions could differ materially from those stated or implied, due to risks and uncertainties associated with its business. Past performance is not necessarily indicative of future results. This presentation is strictly confidential and may not be reproduced or redistributed, in whole or in part, in any form or by any means. © 2020 Gramercy Funds Management LLC. All rights reserved.