Authored by:
- Matthew Maloney, CFA, Partner & Head of Alternatives & Trading
- Matthew Christ, Managing Director & Research Analyst
- Juan Ocampo, Vice President & Research Analyst
- Cyrus Shahabi, Associate & Research Analyst
September 1, 2020 A pdf file of the complete paper can be downloaded here.
The confluence of a global health pandemic, record economic contractions and impressive asset price reflation marks a watershed moment for investors. How does one navigate an historic economic-financial disconnect and, while still facing considerable health-related uncertainties, reconcile the opposing forces holding financial markets together?
The ongoing pandemic has left in its wake a death toll that rivals previous-generational health crises; and will undoubtedly provoke lingering health and safety concerns long after a vaccine is ultimately discovered. The decline and eventual recovery of economic activity will be tethered to dramatically altered social habits that have long been embedded in our DNA. While global markets have bounced sharply since the March doldrums thanks to a series of stimulus initiatives, one must question whether the stark disconnect between asset prices and economic fundamentals will last.
We believe investors in emerging markets (EM) credit will be compelled to confront this conundrum head on. Just as EM obligors grapple with the worst recession since World War II, they have found refuge in the recent rebound in global credit markets – pulled along by stimulus measures in developed markets (DM). Lurking in the background, though, is a host of structural issues brought about by a decade of financial excesses in EM credit that have been spurred on by a boundless search for yield. Should this delicate balance in EM credit markets rupture, Gramercy would expect a significant increase in the frequency and scale of defaults. A top-down look at historical precedents supports this outlook and a bottom-up analysis of EM high yield issuers will frame this cautious investment outlook:
Top-down drivers of EM default: According to our research, historical analysis of previous emerging markets credit crises reveals pre-existing conditions coincident with an increase in credit defaults. The academic literature points to several key precedents: rapid increases in credit to a specific sector, capital flow instability, financial product innovation, and contagion from DM to EM.1, 2 Emerging markets obligors are especially susceptible to distress when exposed to weak global growth, sharp currency moves and sudden commodity price reversals.3
Bottom-up drivers of EM default: Modern corporate finance theory instructs that obligors encounter credit stress through liquidity constraints or excess leverage.4 When obligors experience shocks, like the collapse of revenue in the case of COVID-19 related shutdowns, even strong balance sheets will be tested. As a result, academic researchers have developed a variety of models to predict corporate defaults. Edward Altman’s ‘Z-score’, among the most well-known and widely tested, calculates 6.6% of global corporate issuers currently confront a high probability of distress, with a further 10.7% considered ‘at risk’. 5,6 These Z-scores suggest credit stress is 3-4x greater than the 2.5% high yield default rate recorded by S&P in 2019.
In this paper, we will delineate the deterioration of EM corporate fundamentals over the last decade and describe how a flighty capital base might exacerbate an already tenuous investment landscape (Part I). EM HY defaults will test new highs thanks to a combination of weakened corporate fundamentals and a transition from global GDP growth to contraction in 2020, a phenomenon not seen since World War II (Part II). Distressed investors, consequently, will be forced to navigate this landscape by employing lower entry prices in order to accommodate lower recoveries (Part III). While this paper includes ample empirical evidence to justify heightened default risk, a contrarian view will also be discussed (Part IV).7,8
PART I: Current Landscape Coincident With Credit Stress and Distress
As the impact of the COVID-19 shutdown feeds through 3Q20 performance, the percentage of companies at risk of default should rise even further. The pervasiveness of the shock, including a pronounced and protracted slowdown in economic activity, leads us to conclude that the incidence of distress will be greater than during previous credit cycle troughs. Default rates increase with recessions, but tend to peak towards the end or even after the end of a recession. As we have yet to see a bottom in global GDP, we are likely still far below peak default rates.
Cycles of credit distress require only a handful of external pressures to increase the incidence of default. Today, all the key ingredients for a ‘primordial soup’ of EM defaults are present.
1. EM Credit Susceptible to Capital Outflows
2. Corporate Financial Profile Deterioration
3. Original Sin Persistence
4. Heightened Commodity Risk
5. Aggressive Financing Structures
6. GDP Contraction and EM Contagion
Section A: EM Credit Susceptible to Capital Outflows
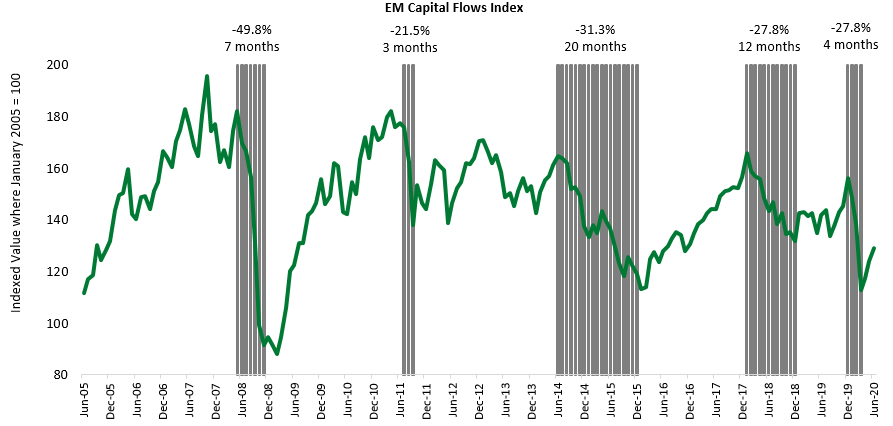
Since the Global Financial Crisis, $327 billion and $161 billion of predominantly foreign capital have flowed into EM hard currency and local currency funds, respectively. The asset class doubled in size over the last decade thanks to a persistent search-for-yield by global investors and impelled by the growth of new investment channels. EM specific ETFs, for example, provided greater access than ever to EM fixed income just at the time when EM solidified its perception as a meaningful source of alpha. Naturally, this attracted ‘tourist’ investors and other ‘hot money’ capital inflows (see Exhibit 1). Unsurprisingly, these types of non-dedicated investors are most prone to abandon the asset class at the first sign of big distress and can therefore exacerbate bouts of capital outflows. As Exhibit 2 demonstrates, inflows often accumulate methodically over time, but outflows typically occur swiftly and can accelerate to -50% in a matter of months; recapturing foregone outflows tends to take several years.
Exhibit 1: EM Capital Flow Volatility

Source: J.P. Morgan. As of June 30, 2020.
Exhibit 2: EM Capital Outflows Occur Much Faster Than Inflows
Source: Bloomberg. As of June 30, 2020.
Severe capital flow cycles pose dual challenges for corporate borrowers as: i) tightening financial conditions make it difficult to roll-over debt at affordable levels; and ii) EM central banks and governments lack the same firepower as their DM brethren to help buffer outflows. We believe EM high yield borrowers are especially vulnerable given their recent growth in indebtedness and reliance on a fickle capital base.
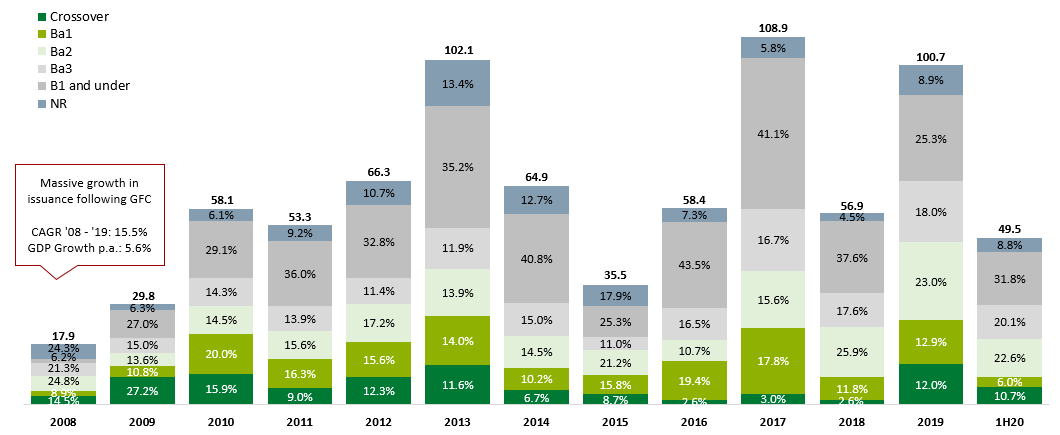
Since 2008, EM HY issuance has grown at a cumulative growth rate of 15.5%. More disconcerting, the riskiest segments of the EM HY universe led this surge in issuance. More specifically, sub-investment grade issuance (Ba2) has grown at 14.8% annually, while high yield (Ba3) and speculative (< B1) issuance have grown at annual rates of 13.8% and 29.9%, respectively. EM GDP (ex. China) grew at 5.6% annually since 2008, which means that speculative credit issuance grew almost 6x faster according to data from Bondradar.
Exhibit 3: EM HY Issuance Exceeded GDP Growth ($ bn)
Source: Bondradar. Corporate bonds issued in hard currency (USD, EUR and GBP); EM ex-China. As of June 30, 2020.
Section B: Corporate Financial Profile Deterioration
Over the last decade, demand for higher yields has led to investor complacency with regard to credit fundamentals enabling an astounding growth in debt at ever lower risk spreads in markets (a phenomenon not unique to EM). Citing data from J.P. Morgan, net leverage for EM HY has grown from 1.1x in 2008 to 3.4x in 2020. Similarly, interest coverage ratios have deteriorated from 7.4x in 2008 to 4.1x in 2020. At the same time, the average yield of EM HY new issues has declined from 8% to 5% and credit spreads tightened from 600bps to 300bps. The growth in passive investing further amplified the deterioration in the relationship between yields and spreads measured against credit metrics. In all likelihood, the typical passive CEMBI investor has not fully digested the extent to which their expensive EM HY holdings are now teetering towards impairment.
Corporate finance theory tells us that, in a typical recession, deteriorating balance sheets arise from a decline in cash flows to levels insufficient to support debt expense.9 Taken to extremes, balance sheets can turn upside down with assets worth less than liabilities. This unusual scenario will likely become more prevalent amidst the COVID-19 recession thanks to the pandemic’s “sudden stop” dynamics, which can arrest cash flows for highly exposed industries (i.e. airlines) to zero overnight.
Exhibit 4: Leverage and Interest Coverage Ratios in EM


Source: J.P. Morgan and Bloomberg. As of June 30, 2020.
With greater incidence of stress and distress in the EM HY universe, it is fair to assume that the corporate primary market will likely be challenged over the next few years. This creates a negative feedback loop in that most HY bonds are ‘bullet’ instruments, which means they are subject to periodic refinancing risk. The looming wall of maturities between 2021 and 2024, included in Exhibit 5, means obligors will have to find a way to refinance $280 billion worth of hard currency bonds against a challenged economic backdrop. Otherwise straightforward liability management exercises could deteriorate into full-blown restructurings in periods of uncertainty or distress.
Exhibit 5: Maturities Peak in The Coming Years ($ bn)

Source: J.P. Morgan. EM hard currency corporate bonds. Excludes China. As of June 30, 2020.
Section C: Original Sin Persistence
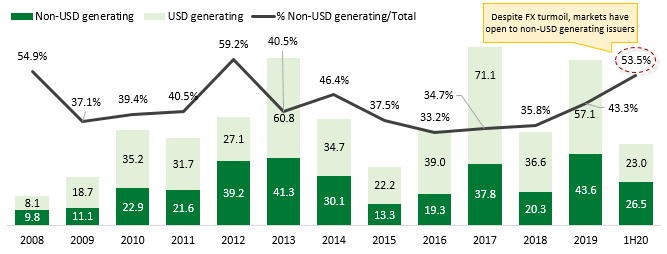
Following the last spike in EM defaults during the Global Financial Crisis, there was an expectation for EM corporates to better align local currency revenue with local currency debt. In reality, we see that non-USD revenue generating issuers still represent a majority of hard currency issuance (See Exhibit 6). These obligors have committed the ‘original sin’, a term used to describe EM issuers who generate revenue in local currency, but must service hard currency debt (we estimate these obligors will need to address $150 billion in amortizations up to 2024). The resulting currency mismatch often leads to financial distress. Most unsettling, EM FX risk is omnipresent. Even in relatively benign markets, like that between 2010 and 2019, EM FX can depreciate more severely than in challenged markets such as 2005 through 2009. As Exhibit 7 illustrates, a basket of 20 EM currencies depreciated by ~40% from 2005 through 2020, but most of the decline occurred after 2009.
Exhibit 6: EM HY Issuances by Non-USD Generating Companies Has Been Increasing
Source: J.P. Morgan. EM hard currency corporate bonds. Excludes China. As of June 30, 2020.
EM exporters, such as miners or agricultural companies, tend to have FX buffers for ‘original sin’ since they generate income in dollars. Non-USD generating industries, such as retail or financial services, are not so lucky. Still, in the era of wide-open primary and capital markets, even issuers exposed to FX risk managed to avoid a wave of distress. Today, non-USD generating obligors account for more than half of new issuance within the EM HY primary market. (Obviously, this condition can only persist when you have commensurate demand growth from hard currency investors.) This enlarged congregation of ‘original sinners’ means that EM investors are exposed to the vicissitudes of weaker and more volatile FX environments.
Exhibit 7: EM Currencies Are Dramatically More Volatile Than DM Currencies

Source: Bloomberg. As of June 30, 2020.
Section D: Heightened Commodity Risk
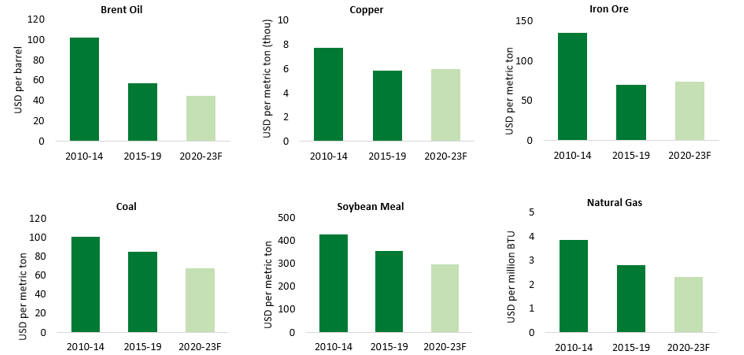
Given their endowment of vast natural resources, the fortune of several emerging markets has long been linked to commodities and their economic health significantly tied to commodity prices. As a result of the COVID-19 shutdown, the medium term outlook for commodity prices looks less encouraging. As Exhibit 8 illustrates, EM commodity producers should expect structurally lower prices; a balance sheet constructed in 2017-2019 won’t necessarily hold up in the near-term.
EM investors used to be able to rely on big exporters’ ability to weather commodity downturns; their scale and monopoly status provided cover. Historically, most commodity producing corporates were either state-owned or state-backed, mitigating their credit risk to a certain extent (Petrobras, CNOOC and Gazprom illustrate the historic dominance of quasi-sovereigns as a percent of EM commodity issuers). Today, the landscape has been altered by favorable capital market conditions over the last several years, which enabled smaller commodity obligors who enjoy explicit or implicit sovereign support to come to market. In total, more than $225 billion has been raised in this space since the Global Financial Crisis (Exhibit 9). The market is already showing signs that smaller commodity players are less able to weather price downturns compared to their larger brethren. The stresses experienced by Gran Tierra (as compared to Ecopetrol) and Cobre del Mayo (as compared to Codelco) demonstrate the importance of sovereign support to commodity dependent companies.
Exhibit 8: Commodity Price Projections
Source: Bloomberg. As of June 30, 2020.
Exhibit 9: High Yield Borrowers Represent a Third of All Commodity-linked Issuers

Source: Bondradar. EM hard currency corporate bonds. Excludes China. As of June 30, 2020.
Section E: Aggressive Financing Structures
The decade preceding the COVID-19 outbreak witnessed an ever-increasing demand for high yield credit products. The resulting liquidity excesses gave rise to a pernicious externality: bond offerings with weak covenant packages, less security and meager disclosure. This was true in developed markets as well as emerging markets. In DM credit, covenant quality steadily deteriorated by 25% from 2012 through 2019, according to Moody’s quantitative LCQI leveraged loan indicator. In EM credit, bond covenant quality declined by a comparable 21% over the last decade. In one of the more egregious examples, a Mexican borrower with virtually no restrictions on dividends registered MXN 1.7 billion in accumulated net losses, promptly paid out MXN 200 million of dividends and then proceeded to default on its debt the next year.
Unlike DM credit markets, where ‘absolute priority’ prevails through well-established legal systems, EM bankruptcy codes are less well defined and vary with jurisdiction. Oftentimes, structural lines can be blurred within the capital stack. It is therefore difficult to understand why investors so willingly accepted the following structurally-impaired offerings:
1. Bonds issued without financials
2. Unqualified restricted payments covenants
3. Billion-dollar credit facility carve-outs
4. 100-year high yield corporate bonds
5. Stripping recourse to all operating entities in distressed exchanges
6. Bonds secured by de facto unenforceable collateral
7. 15-year zero-coupon high yield bonds
Section F: GDP Contraction and EM Contagion
Coronavirus has turned into a severe shock battering global markets, and in particular developed markets, in a way typically experienced by the developing world. In economic terms, global markets are experiencing three irreconcilable phenomena: i) both demand and supply shocks; ii) disruptions to both manufacturing and services; iii) and declines in both domestic and international economic activity. It is highly unusual for both antipodes of any one phenomena to occur at the same time – let alone all three. The confluence of these economic shocks is amplifying market fear and uncertainty.10
To quantify this impact, the World Bank currently expects growth to contract by 5.2% in 2020 – a marked decline from initial OECD estimates back in March that merely reduced 2020 growth forecasts from 2.9% to 1.5%. Moreover, the balance of risk is tilted to the downside.
The magnitude of this contraction falls somewhere between the Global Financial Crisis, which witnessed GDP declines of -2.9%, and World War II, when GDP contracted by -9.8% in 1945. In some ways, the pandemic is harder to avert than war, as the current economic crisis will affect the largest share of global economies since 1870 according to the World Bank. Latin America, the Caribbean and CEMEA will be disproportionately impacted, according to the World Bank, as lower potential growth and stretched balance sheets limit their ability to cope with the crisis.
Exhibit 10: Global Growth Forecasts Point to a Historic Collapse in Global Growth

Source: The World Bank. As of June 30, 2020.
PART II: EM Corporate Default Rate To Test New Highs
The EM corporate default rate, as measured by J.P. Morgan, has only reached double digits twice: in 2002 and 2009. Interestingly, two specific factors preceded both crises: i) an oil price shock and ii) a marked deceleration in global GDP. This aligns well with the pre-existing conditions elucidated in Part 1 (Sections D & F) with regard to heightened commodity risk and GDP contraction. If these two factors are the canary in the coal mine, the canary seems to have died on March 9th.
Exhibit 11: JPM EM Default Rate vs. Brent and GDP


Source: J.P. Morgan, Bloomberg and the IMF. As of December 31, 2019.
Gramercy estimates that EM corporate defaults could top 12% by YE2021. In order to substantiate this claim and organically construct a base case default rate, Gramercy analyzed over 400 individual credits held in the JPM EM Corporate Dollar Index. Gramercy’s analyst team categorized each issuer’s risk of default into one of the following five buckets: imminent, probable, moderate, low and very low. Embedded in the categorization process is an analysis that stresses current credit fundamentals (i.e., liquidity, leverage and capacity to service debt) in a projected cash flow environment reflective of the challenges created by the COVID-19 crisis. The trading price of each bond, and implied default rate, helped bolster Gramercy’s internal default risk score.
PART III: Navigating Higher Incidence Of Distress
We believe EM corporate credit distress in 2020/2021 will exemplify the following dynamics: i) average recovery levels will be lower than the already underwhelming recoveries in prior waves of distress; and ii) market technicals will cause prices to overshoot traditional settling points.
In general, recovery rates in EM have failed to preserve capital for par buyers of defaulted HY credit, with the average recovery wrapped around 35ct. Less creditor-friendly bankruptcy and insolvency regimes in EM are mostly responsible for this.
EM bankruptcy processes are significantly longer and more convoluted compared to bankruptcy regimes in the U.S. and UK. It’s not just that EM restructuring last years longer, but that the extra time ties up capital for longer, which can ultimately result in asset deterioration. In Brazil, for example, the average recovery process takes four years and generates 18 cents on the dollar, compared to one year and 81 cents in the U.S., according to the World Bank Doing Business dataset. Additionally, EM bankruptcy processes generally fail to acknowledge the rule of ‘absolute priority’ – a sacrosanct element of Chapter 11 that essentially establishes that senior class securities must be paid in full before junior classes of creditors and equity receive any proceeds. Too often in formal EM bankruptcies, equity holders retain outsized rights to the detriment of creditors.
Lower recoveries will also derive from deficiencies in the EM restructuring architecture. Fewer resources exist for EM investors when navigating an EM bankruptcy process. Most EMs lack cottage industries of dedicated professionals who specialize in sourcing, financing and restructuring assets. Debtor-in-possession facilities, a mainstay of DM restructurings, often do not even exist as a legal concept in many EM jurisdictions. There is also a paucity of skilled local bankers well versed in restructurings, let alone experienced business operators equipped to help companies emerge from bankruptcy proceedings. Overcoming these inherent challenges means building out a local presence and developing deep local networks. This is where an on the ground presence and deep local networks are essential.
Exhibit 12: Historical Recovery Rates in Global EM and U.S. HY

Source: J.P. Morgan. As of June 30, 2020.
While EM insolvency regimes are slowly improving, critical weaknesses, such as the long restructuring process and absent ‘absolute priority’ rule, continue to overshadow any advances. Therefore, investors should probably view historical recovery rates of the mid-30s as a ceiling. In all likelihood, the myriad pressures COVID-19 has added to the calculus will drive future recoveries lower. GDP contraction means lower cash flow projections for re-engineering balance sheets, lower federal, state and municipal revenue will slow an already underfunded judicial bureaucracy, more bankruptcies and COVID-related protocols (i.e., testing, online legal sessions, etc.) means overwhelmed court systems, and shareholders will continue to enjoy leverage over smaller pools of “new money” used to fund post-reorg business plans in a risk averse environment.
The superficial conclusion then is that investors should avoid EM corporate distress altogether given the arduous path to suboptimal recovery rates. The better conclusion is that so long as they are cognizant of the challenges, conservative in underwriting and agile around entry points, we believe EM investors can make money in distressed corporate credit. Existing EM HY investors should recognize the turning credit cycle as the time to shift exposure higher up the credit quality curve, underscoring the importance of active credit selection and portfolio management.
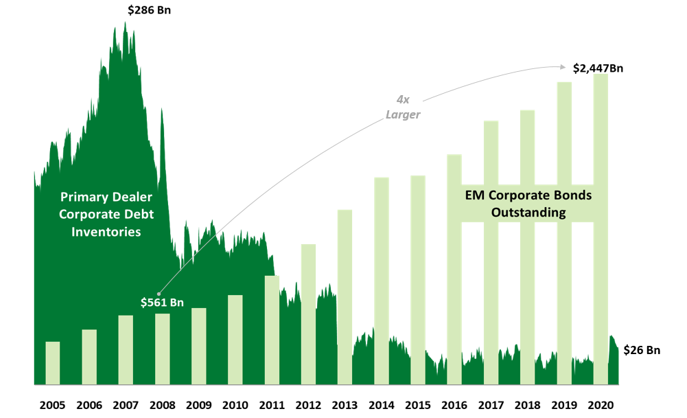
Investors should counter lower expected recoveries with lower entry points – an investment strategy that should be achievable considering the liquidity and regulatory constraints already at play in the market. As illustrated in Exhibit 13, the amount of outstanding EM corporate debt has increased by over 4x since 2008 (from $561 billion to $2,447 billion). At the same time, primary dealer inventory of corporate debt has decreased by over 90% (from $286 billion to $26 billion). Intermediaries, therefore, lack the capacity to process outflows and this typically results in discontinuous pricing.
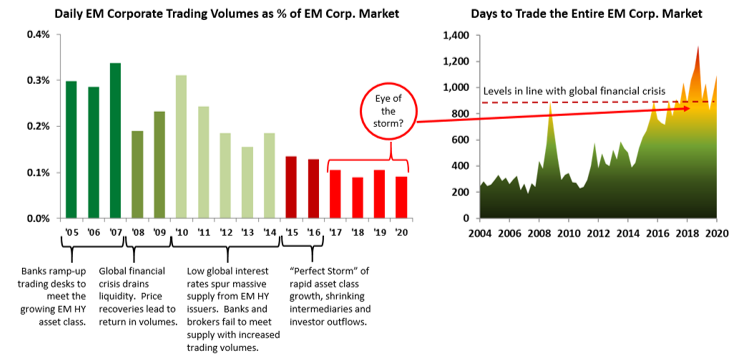
Increased bank regulation has prevented proprietary trading, which in turn discourages banks from market-making. The two most important liquidity providers from a historical perspective are now greatly constrained. Accordingly, in periods of stress like that anticipated in 2020/2021, prices will gap down further and bid-ask spreads will widen dramatically.
Exhibit 13: Mismatch Between Primary Dealer Inventory Balance and Corporate Bonds Outstanding
Source: Gramercy, J.P. Morgan, Federal Reserve Bank of New York. As of June 30, 2020.
Exhibit 14: EM Corporate Trading Volumes at Historical Lows
Source: J.P. Morgan, EMTA. As of March 31, 2020.
PART IV: Risks to Our Thesis
While, in our view, the empirical evidence embedded in this paper validates Gramercy’s conclusions, today’s elevated market prices portray a contrarian viewpoint: EM HY credit is not on the precipice of a historic spike in defaults. What are the conclusions implicit in the market’s benign outlook for EM HY credit?
1. Stimulus can provide a bridge to a post-COVID economic expansion. (Mitigant: Decoupling between financial asset prices and underlying fundamentals can’t last forever.)
2. EM Corporate Credit will continue to look attractive vs. DM credit. (Mitigant: EM becomes a victim of its own success and spreads compress to less attractive levels.)
3. Capacity for a V-Shape recovery to the extent a health solution happens faster than anticipated. (Mitigant: The longer the downturn lasts the more industries will be affected and the longer the recovery will take.)
4. A White Knight – such as China – will provide economic and financial bail outs. (Mitigant: China is unable/unwilling to play that role today and the balance of EM lacks the economic heft.)
5. EM Fiscal and Monetary policy assumes more aggressive stimulus approach. (Mitigant: EM government institutions lack a toolkit or wherewithal to so.)
First, the waterfall of global central bank liquidity could continue unabated. In this scenario, risk tolerance would remain at historic highs and global investors would continue to support a fundamentally deteriorating asset class. Simply put: the music could keep playing, and investors dancing.
At the end of the day, there are limits to endless central bank liquidity. Central bank stimulus can lower global rates to zero and increase capital market access, leading to lower costs of capital for corporate obligors. However, zero rates do not compensate for lost revenue and deteriorating fundamentals. No matter how open primary markets remain or how ‘hot’ secondary markets trade, the fundamental P&L equation must hold. Cash flows must cover interest expense and amortizations in the long run. Otherwise, no amount of short-term liquidity can stave-off default.
Second, EM HY is widely considered the last bastion for “yield” in fixed income so it will likely remain a permanent fixture for asset allocators in a world of low-to-negative rates. For example, EM HY offers a spread pick-up of approximately 60bp compared to its HY peers. The pickup increases further when we strip-out the oil and gas sector which represents a larger and more distressed component of US HY. EM HY will remain attractive not only to dedicated investors but also to “tourists”, which, when combined, will facilitate refinancings and thereby help stave-off defaults. However, this will only endure so long as a sufficient spread pickup persists.
Third, the world could experience a sharp V-shaped recovery. A scenario in which global supply and demand chains abruptly pick up where they left off will leave most borrowers bruised but not bankrupt. In that case, most corporations will muddle along and investors simply overlook revenue and earnings impairments as “one-offs” and blindly roll over their investments. Moving forward, investors might view 2020 as a mere footnote and underwrite future investments on the basis of “COVID-adjusted EBITDA”.
Ultimately the inflection point becomes a question of time versus capacity to pay. Thus far, six months have passed without a V-shaped economic recovery; for sectors most exposed to the COVID-19 shock (i.e., airlines, tourism, and real estate), CFOs took just 3-4 months to reach the point where they could no longer feasibly service debt and elected to default. Every day that passes without a V-shaped recovery increases the likelihood that new sectors and companies will reach their capacity to pay inflection point. While some companies may be able to endure into 2021, the absence of an economic recovery by the end of 2020 will cause many new companies to grapple with the brink of nonpayment.
Fourth, a country or region could lead the global economy out of recession, just as China did in the wake of the GFC. Re-ignited domestic demand, thanks to heavy public sector-led stimulus, drove global recoveries in trade and commodity prices. In turn, an improving external environment supported FX and capital flow dynamics in China and the rest of EM, resulting in a period of strong asset class outperformance. Today, China lacks the fiscal or monetary headroom to produce a sequel. High corporate debt levels, for starters, limit China’s ability to take on more leverage. Additionally, China’s strategic decision to pivot away from being the world’s manufacturing hub makes jumpstarting a service-led economy more difficult. Lastly, in addition to the structural challenges inherent with aging populations and increasing labor costs, China must confront a new global trade regime in which partners diversify their now-less resilient supply chains and government-to-government tensions deepen.
Exhibit 15: Does China Have the Wherewithal to Stage a Sequel?

Source: Bloomberg, National Bureau of Statistics of China, State Administration of Foreign Exchange of China. As of June 30, 2020.
Finally, EMs could follow the path of several DMs and assume massive budgetary deficits, increasing public debt to ‘bridge’ their economies through this crisis. Heavyweight DMs, like the U.S. and Japan, have dedicated as much as 20% of GDP to combat the COVID-19 shutdown in 2020 and more is likely required in 2021. Mere mortals, like Brazil and Ecuador, have dedicated far less treasure, closer to 5%, not because they lack the willingness but because they lack the ability.
EM HY corporate obligors who are hoping for a bailout may be left holding their breath. As Gramercy concludes in its paper, “The Paradigm of Non-Payment”, EMs simply do not have the fiscal space to bail-out all ‘essential’ corporations or the monetary space to run massive QE programs. The notion that smaller scale solutions like payroll or income tax holidays will make up the shortfall seems farfetched. With dwindling resources and mounting unemployment, why would Ministries of Finance prioritize saving individual corporations over the greater good?
Conclusion:
When asked “How did you go bankrupt?”, in The Sun Also Rises by Ernest Hemingway, Mike Campbell responds: “Two ways. Gradually, then suddenly.”
For EM HY corporate obligors too, the wellsprings of a default wave have been bubbling gradually to the surface for the better part of a decade. Deteriorating corporate fundamentals, capital base instability, FX and commodity vulnerabilities, diminished financial intermediation and investor apathy collectively form the basis of this instability. The great COVID-19 shutdown has further intensified these risks so suddenly that the likelihood of higher default rates has increased substantially. As long as investors are cognizant of the challenges, conservative in underwriting and agile around entry points, we believe EM investors can make money in distressed corporate credit.
Works Cited
1 Kindleberger and Aliber, Manias, Panics and Crashes
2 Reinhart and Rogoff, This Time is Different: Eight Centuries of Financial Folly
3 Ocampo and Bertola, The Economic Development of Latin America Since Independence; Bustillo and Velloso, Debt Financing Rollercoaster: Latin American and Caribbean Access to International Bond Markets since the Debt Crisis, 1982 – 2012
4 Moyer, Distressed Debt Analysis
5 Altman, Hotchkiss and Wang, Financial Distress, Restructuring and Bankruptcy
6 Altman Z-Scores calculated based on data from S&P’s Compustat Database, 2020.
7 For the purpose of our analysis, we exclude issuers from China which we believe is an entire region that operates on its own rules of engagement.
8 As laid out in Gramercy’s 6/25 “Decoding the Global Macro Environment” and the 5/19 Emerging Markets Debt Relief and the “Paradigm of Non-Payment”
9 Moyer, Distressed Debt Analysis
10 “Paradigm of Non-Payment”, Mohamed El-Erian and Robert Koenigsberger, March 2020.
About Gramercy
Gramercy is a dedicated emerging markets investment manager based in Greenwich, CT with offices in London and Buenos Aires and dedicated lending platforms in Mexico City and Istanbul. The firm, founded in 1998, seeks to provide investors with superior risk-adjusted returns through a comprehensive approach to emerging markets supported by a transparent and robust institutional platform. Gramercy offers alternative and long-only strategies across emerging markets asset classes including multi-asset, capital solutions, private credit, distressed debt, USD and local currency, sovereign, high yield/corporate debt, and special situations. Gramercy is a Registered Investment Adviser with the SEC and a Signatory of the Principles for Responsible Investment (UNPRI). Gramercy Ltd, an affiliate, is registered with the FCA. For more information, please visit www.gramercy.com
Contact Information:
Gramercy Funds Management LLC
20 Dayton Ave
Greenwich, CT 06830
Phone: +1 203 552 1900
www.gramercy.com
Joe Griffin
Managing Director, Business Development
+1 203 552 1928
[email protected]
Investor Relations
[email protected]
This document is for informational purposes only, is not intended for public use or distribution and is for the sole use of the recipient. It is not intended as an offer or solicitation for the purchase or sale of any financial instruments or any investment interest in any fund or as an official confirmation of any transaction. The information contained herein, including all market prices, data and other information, are not warranted as to completeness or accuracy and are subject to change without notice at the sole and absolute discretion of Gramercy. This material is not intended to provide and should not be relied upon for accounting, tax, legal advice or investment recommendations. Certain statements made in this presentation are forward-looking and are subject to risks and uncertainties. The forward-looking statements made are based on our beliefs, assumptions and expectations of future performance, taking into account information currently available to us. Actual results could differ materially from the forward-looking statements made in this presentation. When we use the words “believe,” “expect,” “anticipate,” “plan,” “will,” “intend” or other similar expressions, we are identifying forward-looking statements. These statements are based on information available to Gramercy as of the date hereof; and Gramercy’s actual results or actions could differ materially from those stated or implied, due to risks and uncertainties associated with its business. Past performance is not necessarily indicative of future results. This presentation is strictly confidential and may not be reproduced or redistributed, in whole or in part, in any form or by any means. © 2020 Gramercy Funds Management LLC. All rights reserved.
